Solana Price Forecast: Bulls in deep slumber despite ETFs approval buzz
- Solana ticks higher on Tuesday after a failed bullish start to the week.
- Galaxy Digital adds $63 million in SOL staking while the SEC deals with eight pending Solana ETF applications.
- A surge in long liquidations triggers a decline in SOL Open Interest, indicating low optimism.

Solana (SOL) recovers above $150, experiencing a surge of over 1% at press time on Tuesday, signaling a gradual recovery. The rising approval chances of Solana Exchange Traded Funds (ETFs) in the crypto market, with the recent S-1 application by Coinshares, while Galaxy Digital expands its staked SOL holdings by $63 million, could reignite a bullish trend in the token price.
However, optimism in Solana derivatives declines as an aftereffect of SOL's pullback on Monday.
CoinShares files S-1 application for Solana ETF amid rising approval odds
Eric Balchunas and James Seyffart, ETF analysts at Bloomberg, highlighted the 90% odds of Solana ETF approval in an X post on Wednesday. Amid increased chances, CoinShares filed an S-1 application for the SOL ETF on Friday, becoming the eighth issuer to do so.
Previously, Grayscale, VanEck, 21Shares, Canary, Bitwise, Franklin, and Fidelity had an S-1 application. The hype around improving odds could reignite a bullish trend in Solana.
Galaxy Digital boosts its SOL staking portfolio
Galaxy Digital, a US-based investment firm, has staked $63 million worth of SOL in the last 24 hours. In a two-step process, the firm first staked 260,000 SOL worth $40.7 million, followed by a second deposit of 150,000 SOL worth $22.7 million.
Arkham Intelligence data shows Galaxy Digital’s SOL staking reaching 660.00K SOL worth $101.01 million, with the 122.99K SOL in holding worth $18.82 million. The growing institutional support for Solana alongside the SOL treasuries created by Solana Strategies, DeFi Development Corp, and Upexi boosts the bullish sentiment.
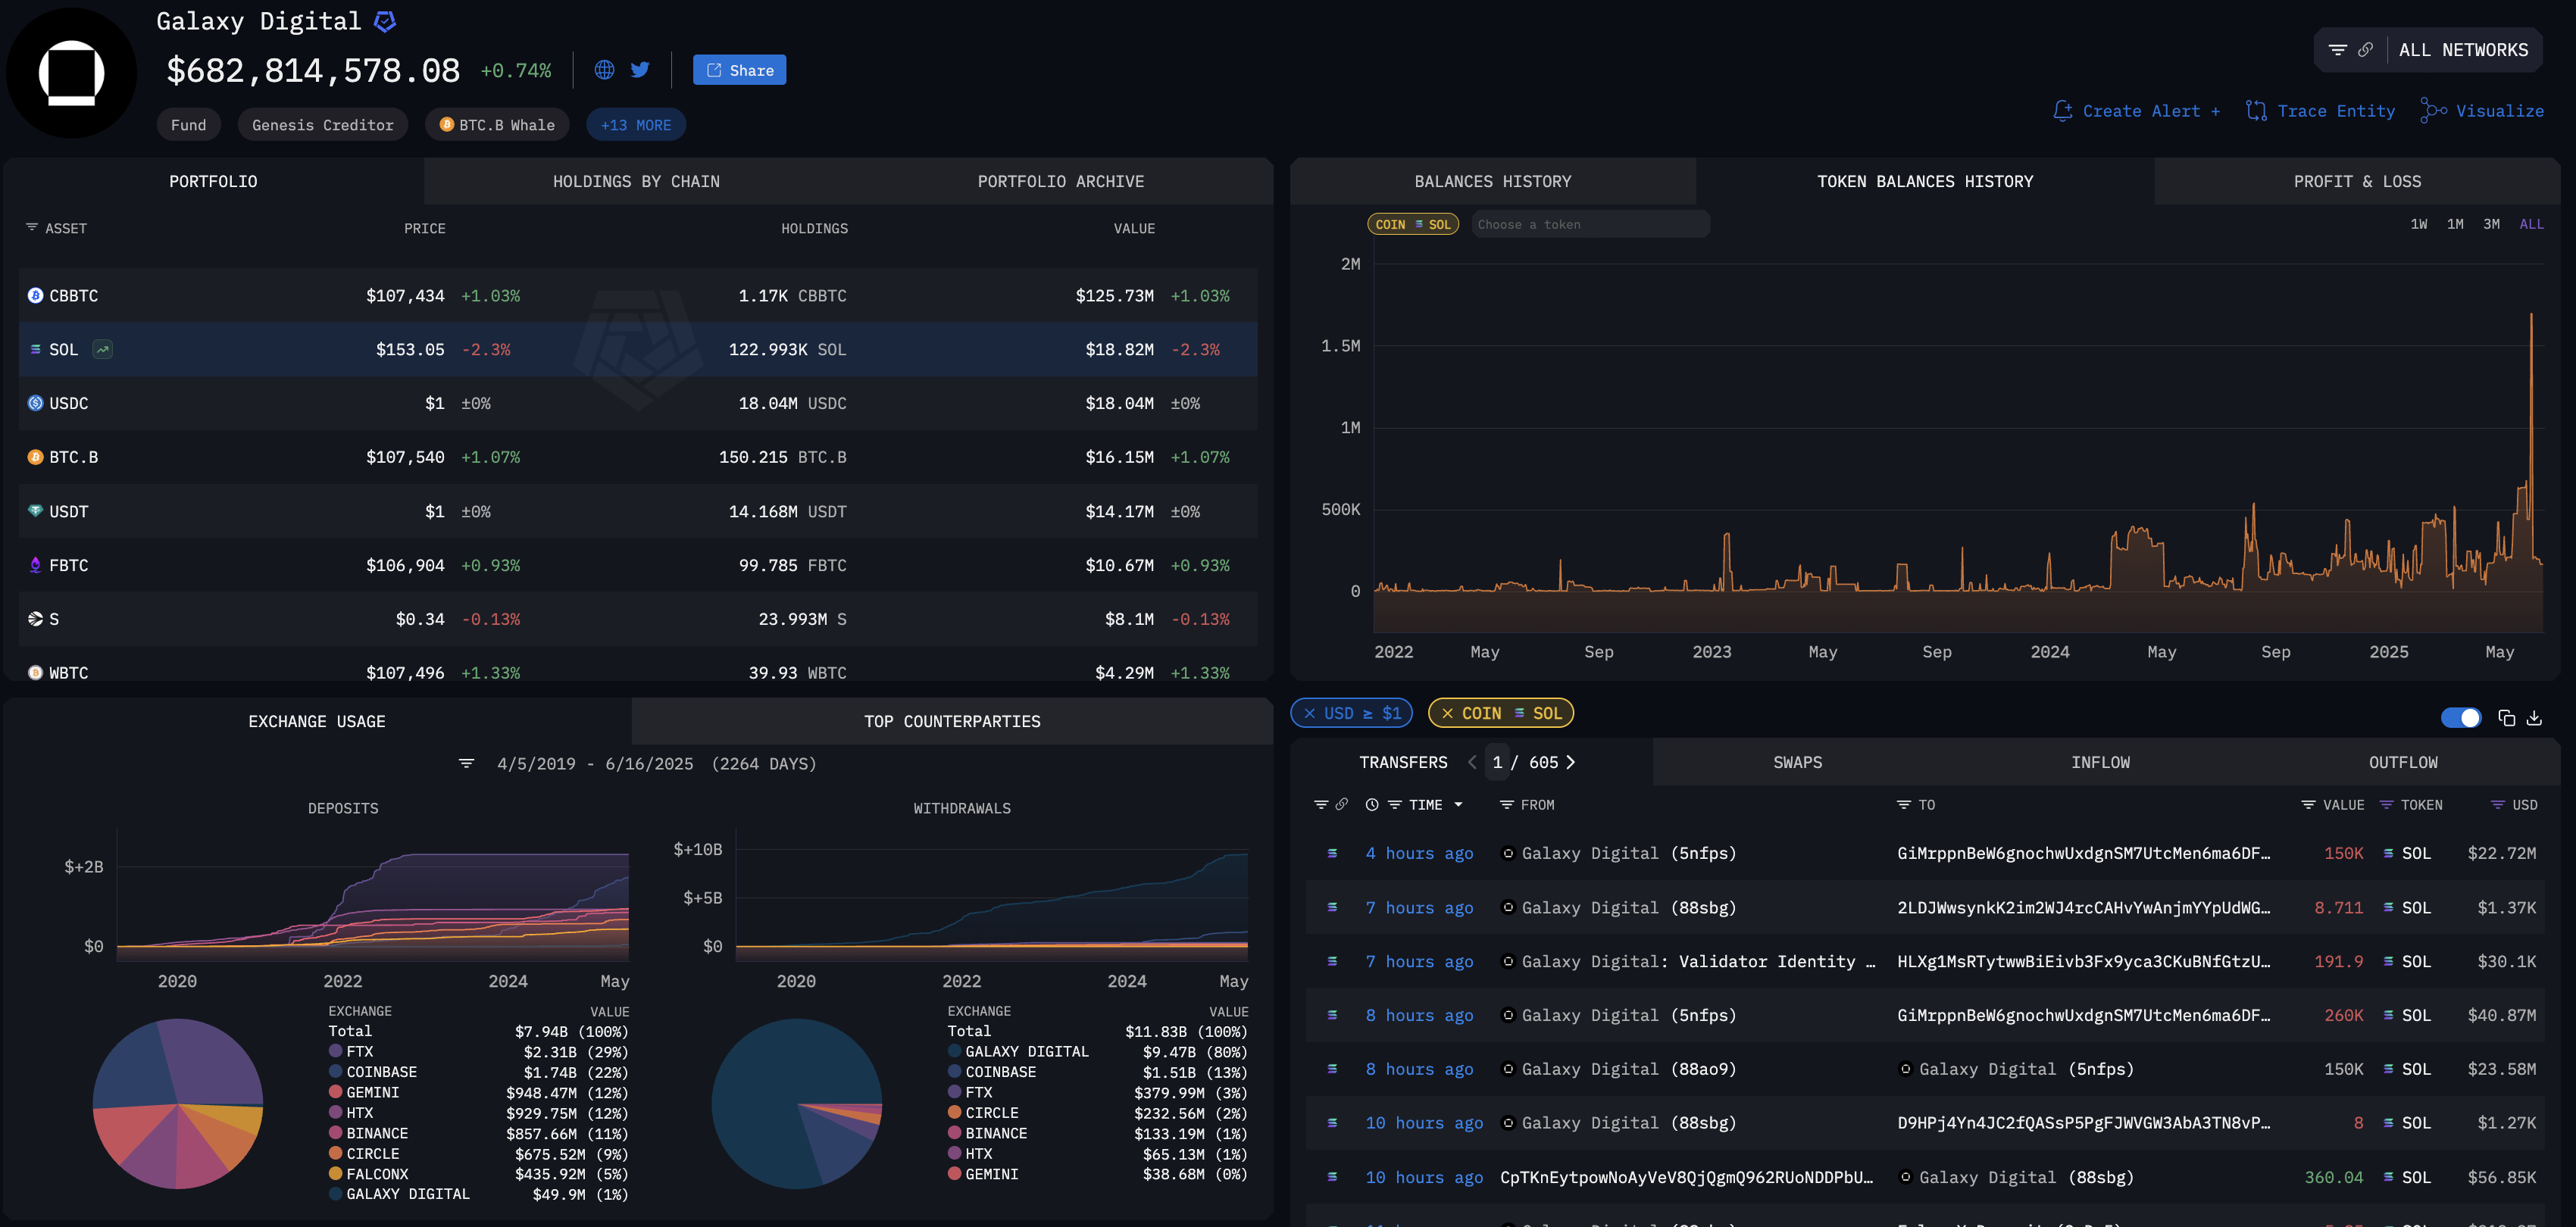
Galaxy Digital holdings. Source: Arkham Intelligence
Solana’s reversal to face a key resistance trendline
Solana is holding the reversal rally from the $140 support zone, trading above $150 at the time of writing. With the intraday rise, the path of least resistance in SOL targets the overhead trendline formed by peaks on January 18, May 13, May 22, and June 11.
According to Fibonacci levels, retraced from the all-time high of $295 to the year-to-date low of $95, the 50% retracement level is located at $167. Investors trapped at a higher level could fuel buying pressure with this level breakout intent, to find better exit spots.
A close above the multi-month resistance trendline, near the 50% retracement level at $167, could extend the recovery to $191, aligning with the 61.8% Fibonacci level.
The Moving Average Convergence/Divergence (MACD) indicator inches closer to triggering a buy signal by crossing above its signal line on the daily chart. A potential crossover will sprout bullish histogram bars from the zero line, indicating a trend reversal.
The Relative Strength Index (RSI) at 47 heads higher towards the halfway line, indicating a growth in bullish momentum. A crossing above the 50 value could increase breakout chances for Solana with significant room for growth before reaching the overbought boundary.
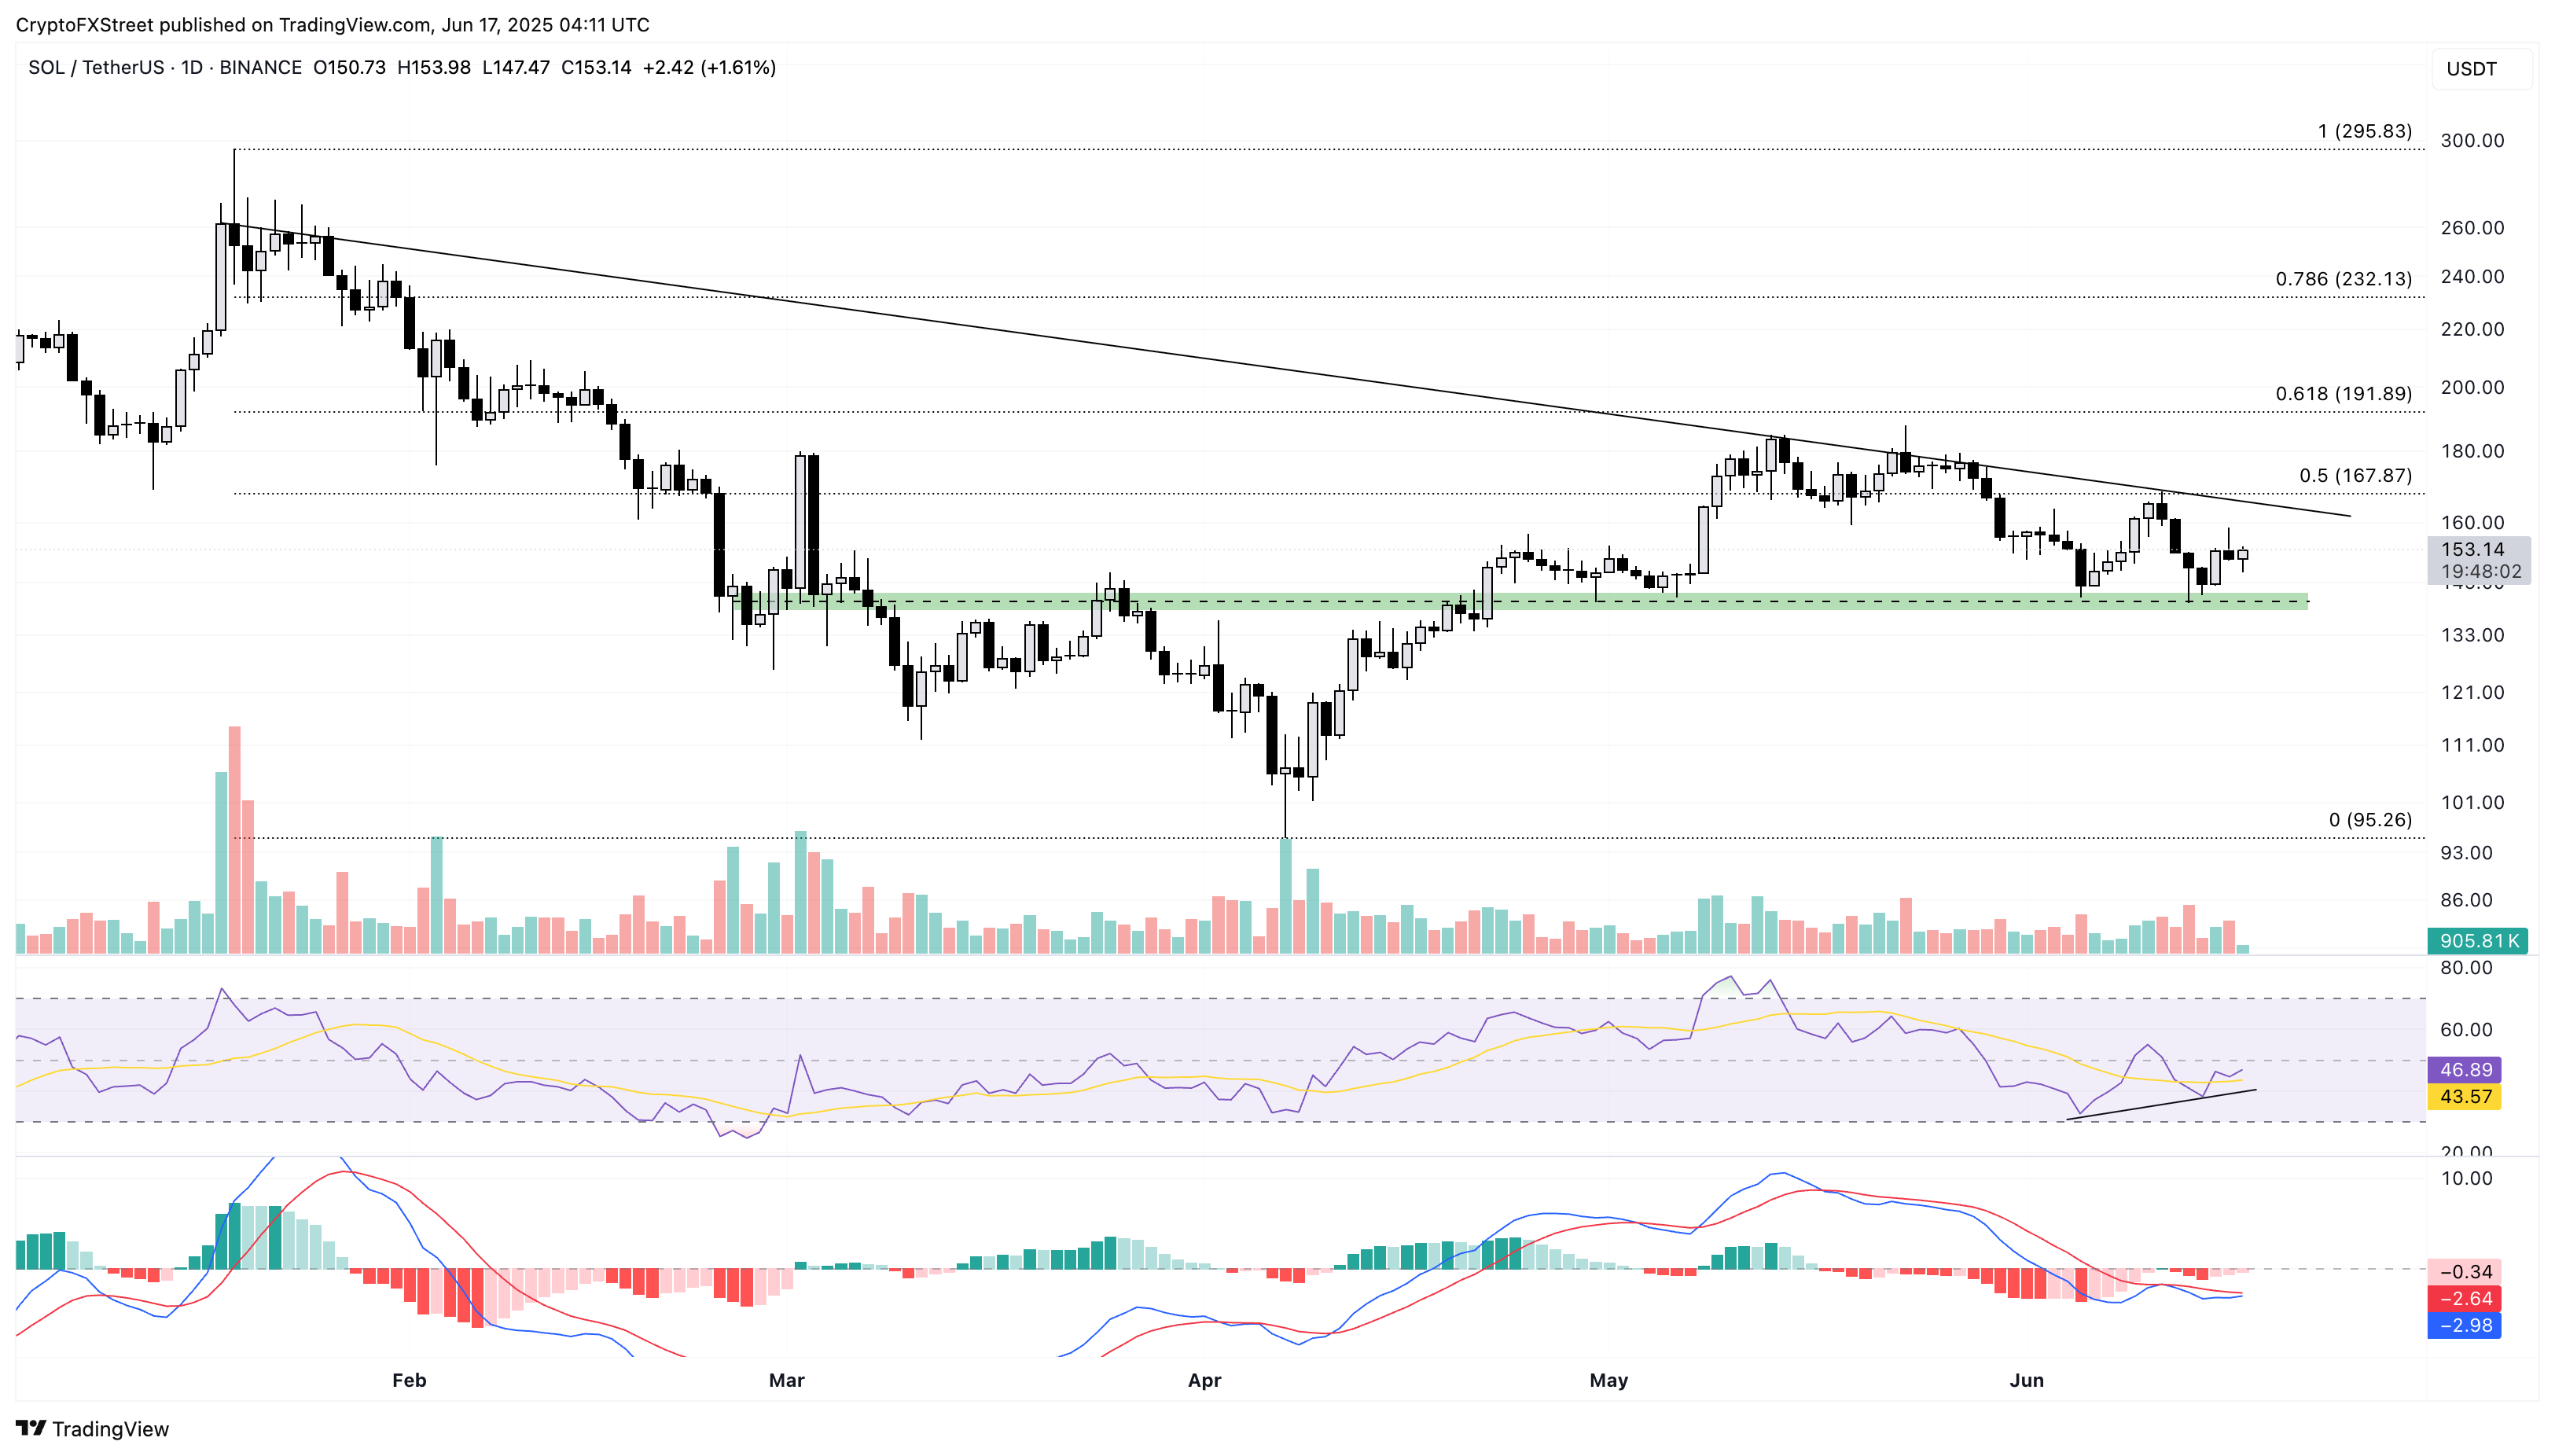
SOL/USDT daily price chart.
However, the optimism in the derivatives market is significantly low as Open Interest (OI) drops by over 7% in 24 hours, reaching $6.37 billion. A drop in OI is typically characterized by investors withdrawing capital from open contracts, suggesting lowered bullish expectations.
Catalyzing the outflow, the long liquidations surge to $15 million compared to just $4 million in short liquidation. The massive difference between liquidations highlights a significantly larger wipeout of bullish traders.
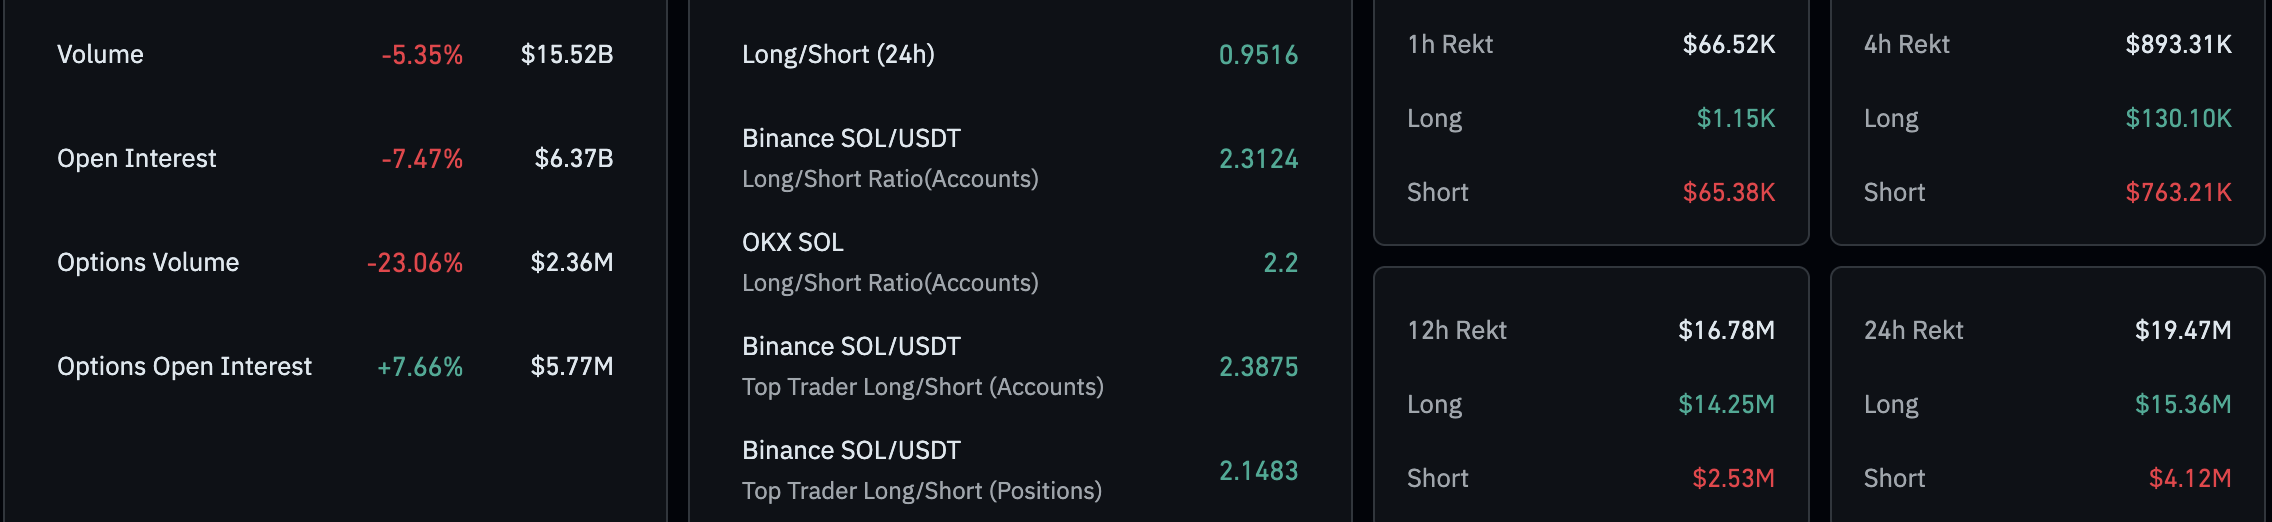
Solana Derivatives. Source: Coinglass
As optimism declines, a closing below $140 could extend SOL's downfall towards the $100 psychological level.
Author

Vishal Dixit
FXStreet
Vishal Dixit holds a B.Sc. in Chemistry from Wilson College but found his true calling in the world of crypto.


