Solana, Sui Price Forecast: Bulls aim for steady recovery ahead of large token unlocks
- Solana sustains recovery within an ascending channel bolstered by strong support at $140.
- Solana and Sui are to face large token unlocks of around $73 million and $10 million, respectively, which may increase the circulating supply and potentially dampen the recovery.
- Sui holds above a key descending trendline support as the RSI reverses the trend upward, signaling increasing bullish momentum.

Solana (SOL) and Sui (SUI) altcoins are edging higher on Monday, building on the weekend gains that followed the sell-off on Friday, which was triggered by geopolitical tensions in the Middle East.
This recovery extends across the broader cryptocurrency market, with leading digital assets such as Bitcoin (BTC), Ethereum (ETH) and Ripple (XRP) upholding respective bullish outlooks.
Meanwhile, select tokens, including SOL and SUI, will encounter both large cliff and linear token unlocks this week, summing to $443 million.
Solana, Sui launch recovery ahead of large linear token unlocks
The altcoin market is characterized by frequent large cliff and linear token unlocks, with the potential to lead to high volatility and sell-side pressure. According to the data shared by Tokenomics, approximately 465,770 SOL valued at around $73 million will be unlocked on Monday, representing 0.09% of the circulating supply.
At the same time, SUI faces a 3.35 million linear token unlock valued at around $10 million. Cliff unlocks refer to large one-time unlocks exceeding $5 million, while linear unlocks represent large daily unlocks exceeding $1 million.
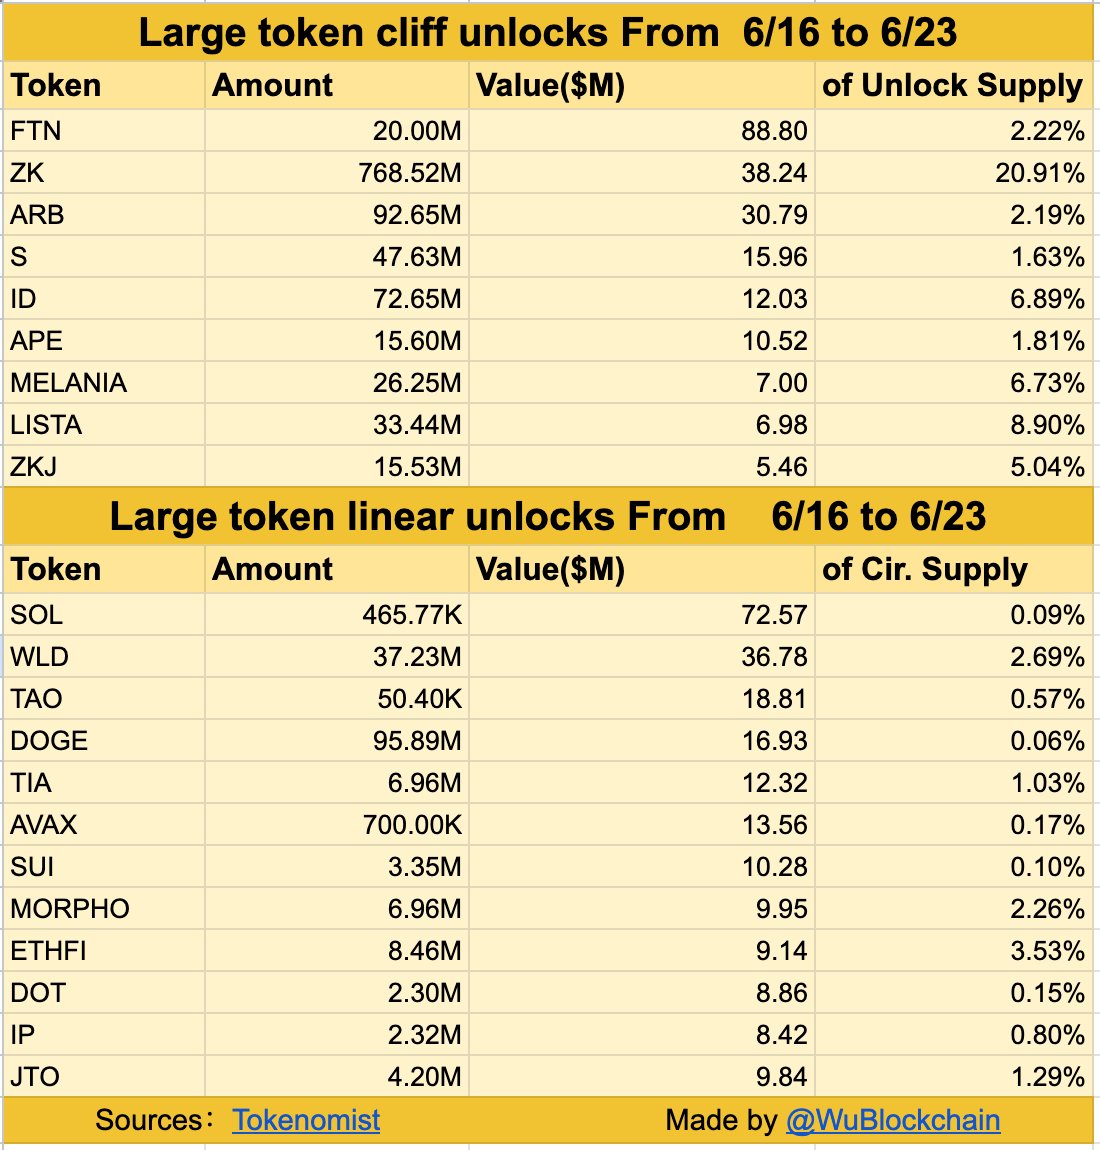
Token unlocks stats: Source Tokenomics (table prepared by Wu Blockchain)
Technical outlook: Solana gains bullish momentum
Solana’s technical structure is gaining strength after last week’s sell-off, with the price now holding at $156. The demand zone coincided with the ascending channel’s lower boundary support, which had been sustained since the support was established in April at around $95.
The Relative Strength Index (RSI) uptrend, close to the midline, signals improving bullish sentiment, likely to steady gains and target resistance at $200, approximately 28% above the current price level. A continued movement of the RSI toward the overbought region would go a long way to uphold risk-on sentiment in upcoming sessions.
Traders will look for a break above the resistance due to the confluence of the 50-day Exponential Moving Average (EMA) and 100-day EMA around $157. The 200-day EMA sits slightly above the confluence, highlighting a potential risk to the uptrend near $162.
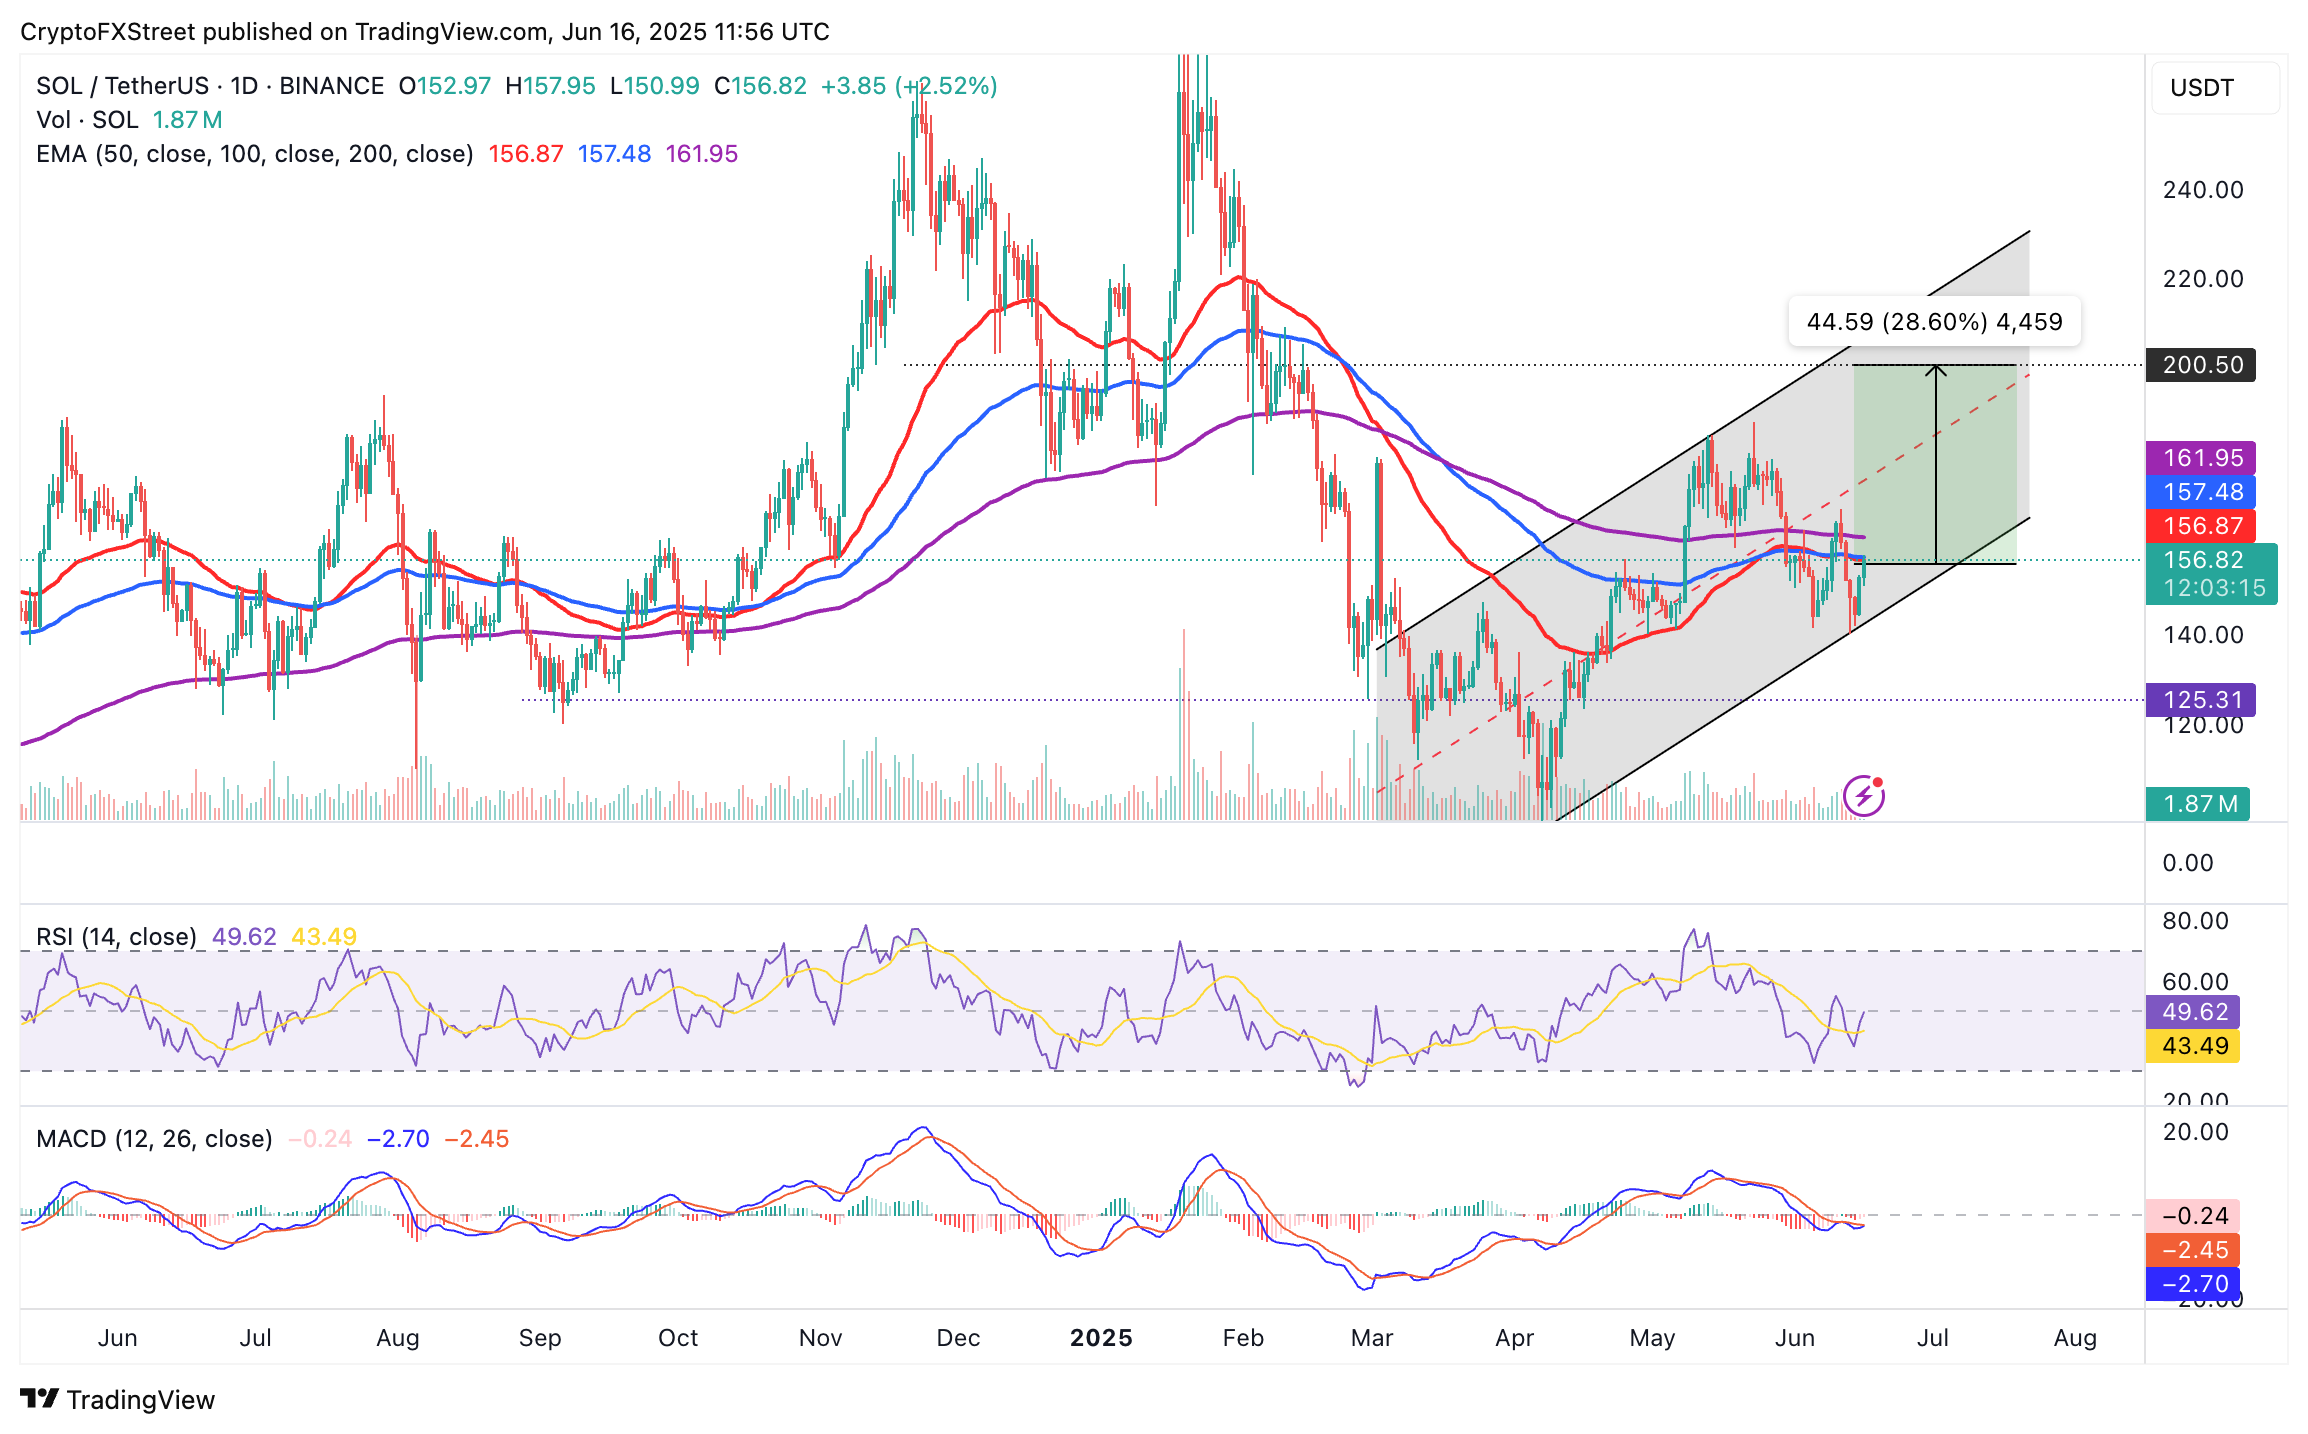
SOL/USDT daily chart
Sentiment in the broader cryptocurrency market has the potential to impact Solana’s price performance, particularly amid tensions between Israel and Iran. Therefore, traders should recognize the role played by demand at $140 as well as the ascending channel in the face of the token unlock.
Sui technical outlook: Sui edges higher, but downside risks remain
Sui’s price bounced off support provided by a descending trendline after extending losses to $2.80 on Friday. With gains accruing to almost 3% at the time of writing on Monday, the path of least resistance leans firmly upward.
The RSI indicator’s recovery, approaching the 50 midline, suggests increasing bullish momentum. Sui’s immediate downside is protected by support provided by the 200-day EMA at $3.06.
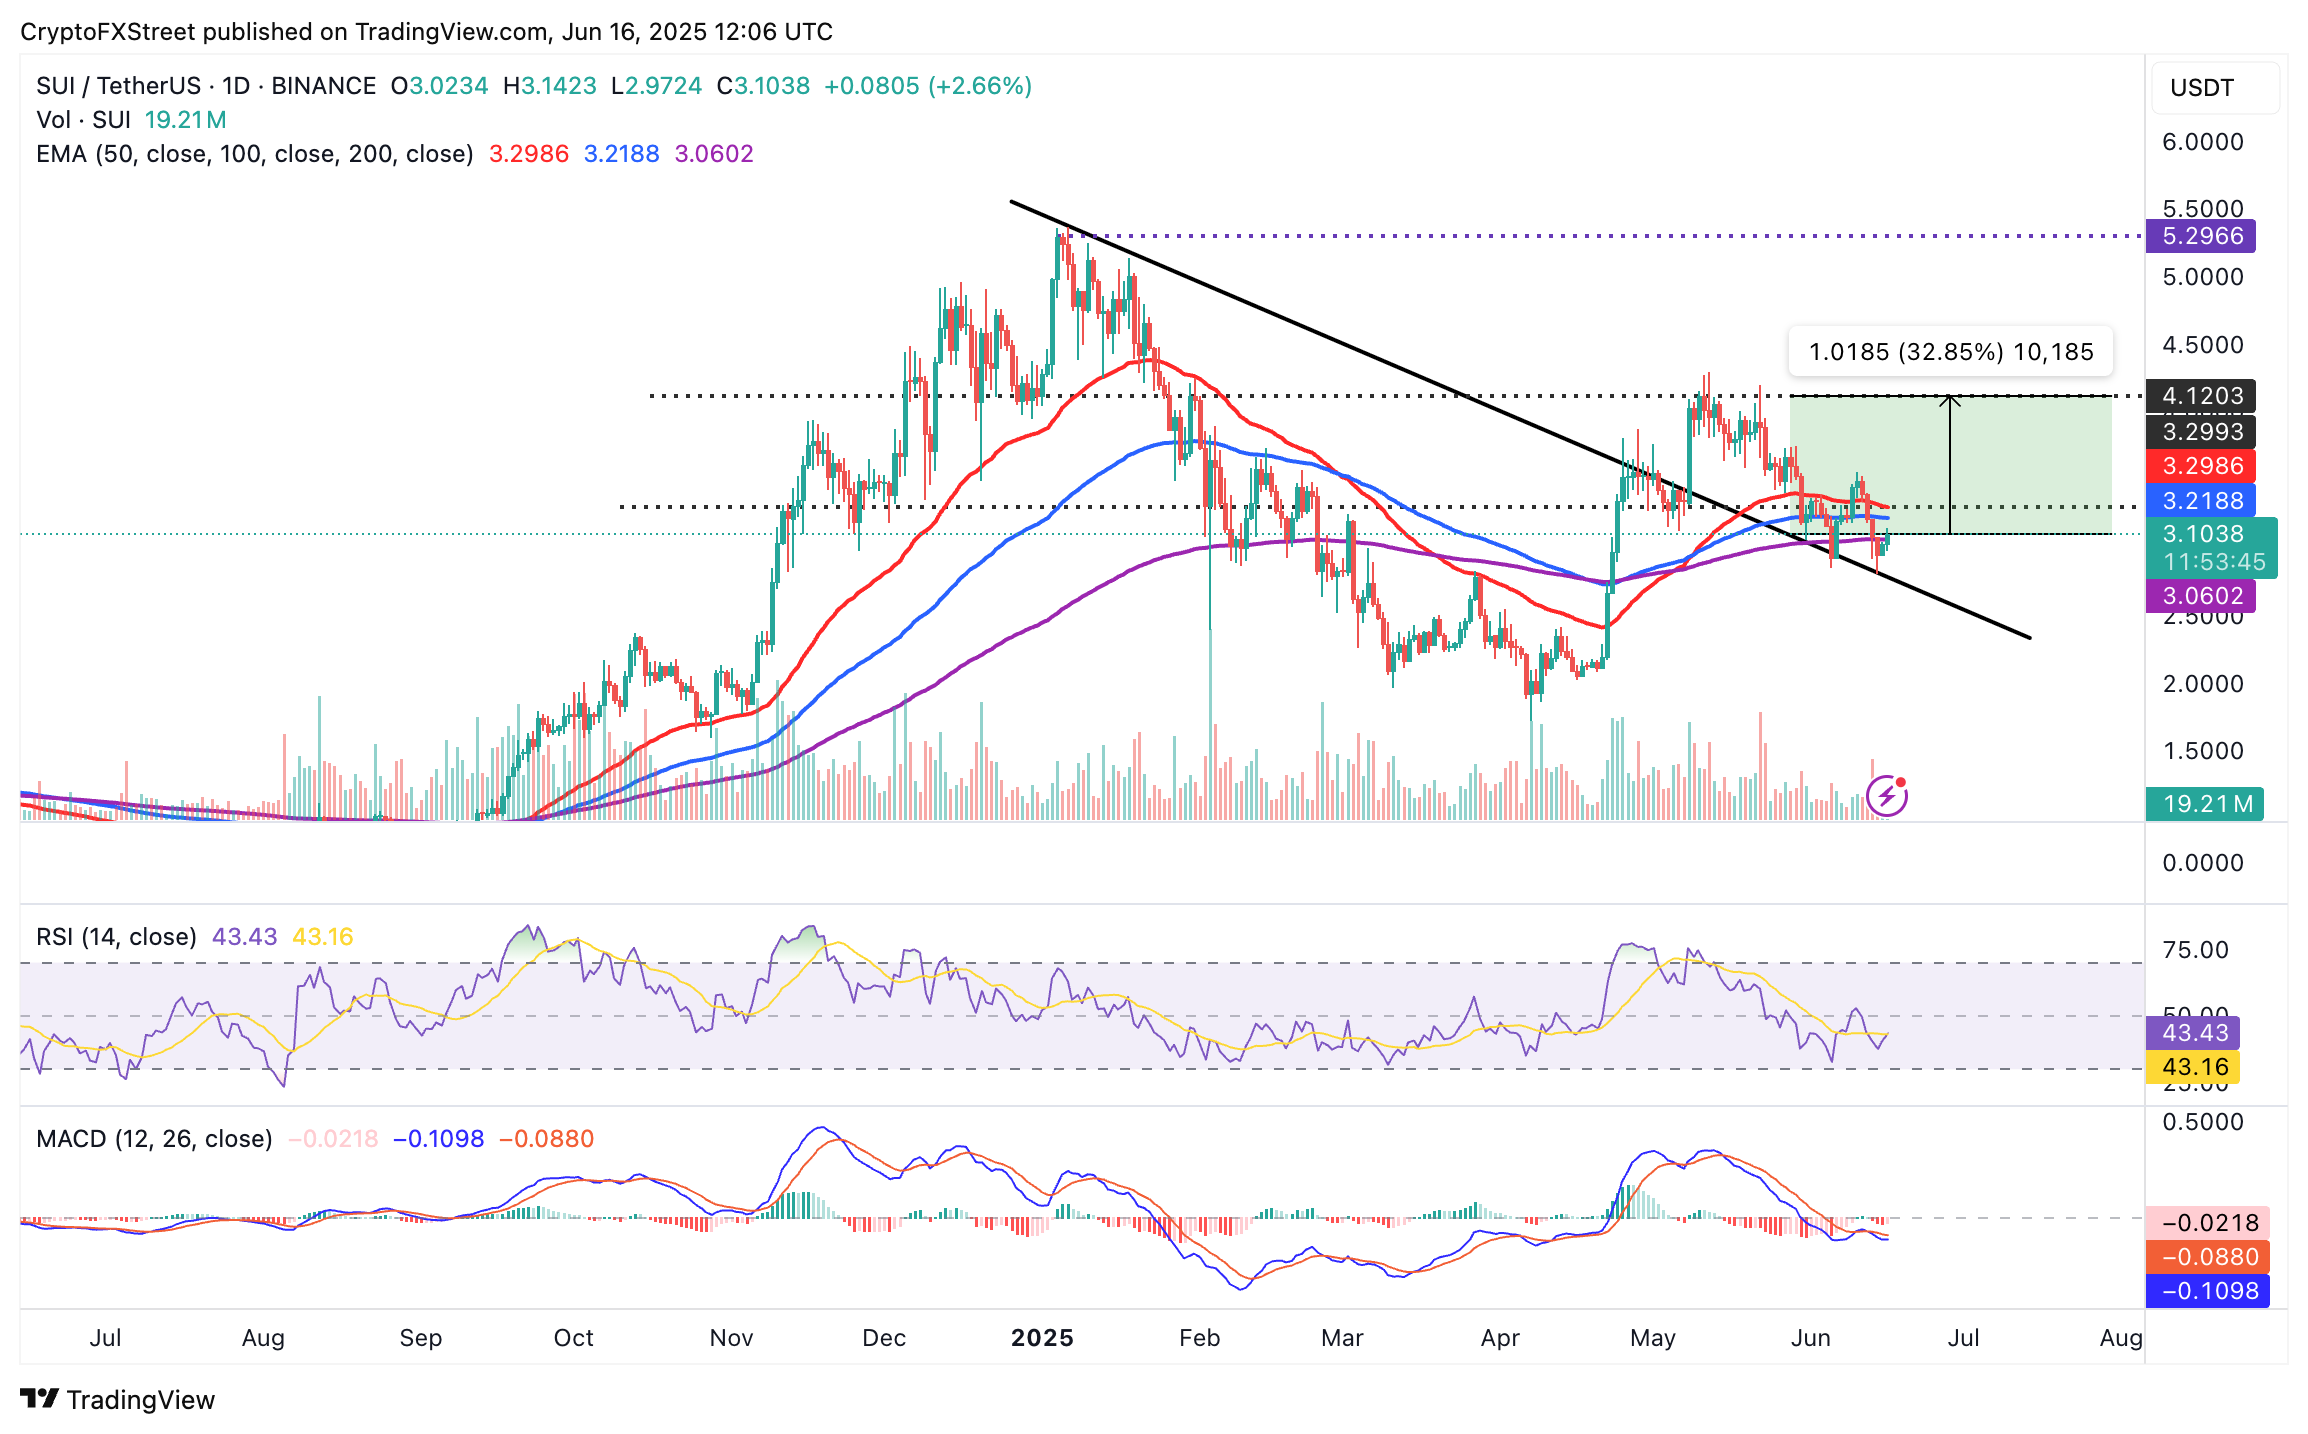
SUI/USDT daily chart
However, traders should be aware of a potential delay in the recovery, as resistance is expected at the 100-day EMA, around $3.21 and the 50-day EMA, at $3.29, which could encourage profit-taking.
A break above these two key levels could see bulls expand their scope to $4.12, representing a 33% increase in value to touch the previous month’s high.
On the downside, beyond the descending trendline, declines have the potential to accelerate, bringing key areas such as $2.50 and $2.00 into sight.
Open Interest, funding rate FAQs
Higher Open Interest is associated with higher liquidity and new capital inflow to the market. This is considered the equivalent of increase in efficiency and the ongoing trend continues. When Open Interest decreases, it is considered a sign of liquidation in the market, investors are leaving and the overall demand for an asset is on a decline, fueling a bearish sentiment among investors.
Funding fees bridge the difference between spot prices and prices of futures contracts of an asset by increasing liquidation risks faced by traders. A consistently high and positive funding rate implies there is a bullish sentiment among market participants and there is an expectation of a price hike. A consistently negative funding rate for an asset implies a bearish sentiment, indicating that traders expect the cryptocurrency’s price to fall and a bearish trend reversal is likely to occur.
Author

John Isige
FXStreet
John Isige is a seasoned cryptocurrency journalist and markets analyst committed to delivering high-quality, actionable insights tailored to traders, investors, and crypto enthusiasts. He enjoys deep dives into emerging Web3 tren


