- Solana price has made multiple attempts to break above the $26.30 resistance level but none of them succeeded.
- A retest of the equilibrium level at $17.18 could pump SOL to break out due to uncollected liquidity.
- Time is a factor for traders to buy Solana at fair market value to avoid missing the next bullish attempt.
Solana (SOL) price has been trading with a bullish bias after an explosive breakout on December 30. However, because of volatility and the gloom in the broader crypto market, SOL has been unable to break above a key hurdle at $26.30, causing the price to trade sideways.
Also Read: Solana price back above $20 as SOL sees a spike in active users
Solana price could rally 50%
Solana price is bearing the brunt of an overly volatile market and a broader lack of momentum. This comes as Bitcoin (BTC) has failed to inspire a wave of bullishness across altcoins. Nevertheless, SOL shows some optimism indicated by its multiple attempts to break above the hurdle at $26.30.
The Ethereum (ETH) killer trades between a market range between $26.30 and $8.07. To gain sufficient momentum that could facilitate the uptrend, Solana price could fall to the equilibrium at $17.18 before a breakout that could see SOL tag the $26.30 resistance level, which would represent a 50% increase. Solana trades at $21.1 at the time of writing.
This equilibrium is critical, as it would provide an opportunity for traders to accumulate SOL at fair market value. The ensuing buying pressure could fuel the uptrend, delivering Solana price to the target. In a highly bullish case, the altcoin could shatter this hurdle to record a new range high above the psychological $32.00 level.
Notably, when markets go below equilibrium, they do not spend much time below this level. In fact, there is usually a very dynamic price move away from that zone, especially if the context behind that market is bullish. As such, Solana price could break out as postulated above, thereby adding credence to the bullish thesis.
To support this thesis, the Relative Strength Index (RSI) had moved above the midline and points north, indicating rising bullish momentum. The Awesome Oscillator (AO) was also inclined to support the growing bullish momentum idea as it was drawing closer to the midline. Both metrics appear to support the bounce-off equilibrium thesis, spelling doom for the bears.
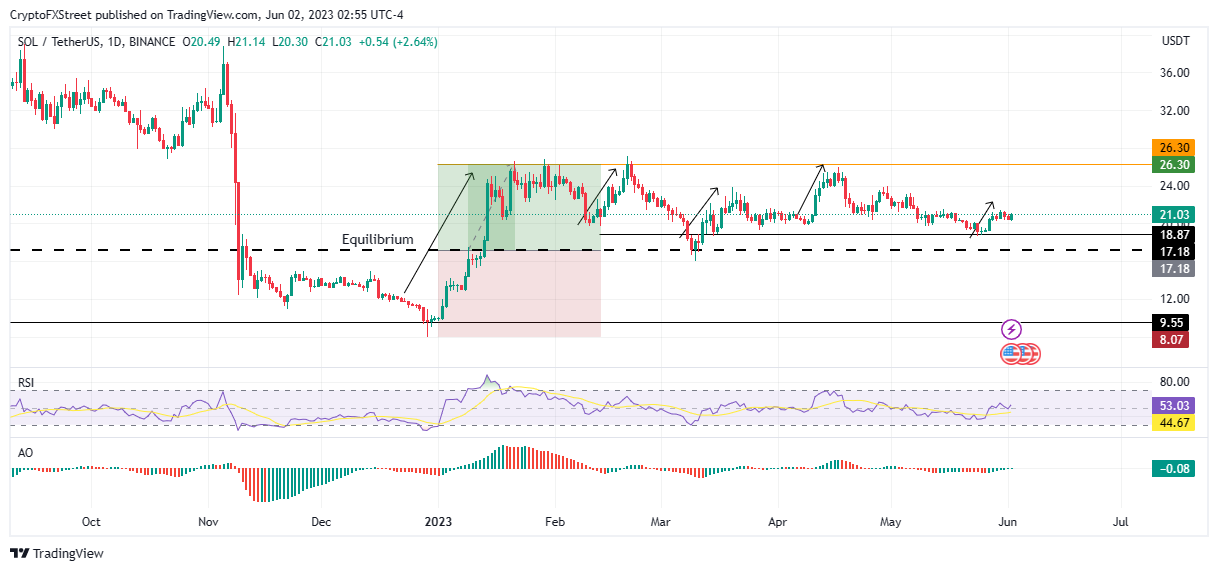
SOL/USDT 1-Day Chart
On the other hand, an increase in selling pressure countered by a less-than-sufficient buying power from the bulls could see Solana price head lower, potentially breaking below the discount zone to collect the liquidity below $9.55 at around $8.07.
Information on these pages contains forward-looking statements that involve risks and uncertainties. Markets and instruments profiled on this page are for informational purposes only and should not in any way come across as a recommendation to buy or sell in these assets. You should do your own thorough research before making any investment decisions. FXStreet does not in any way guarantee that this information is free from mistakes, errors, or material misstatements. It also does not guarantee that this information is of a timely nature. Investing in Open Markets involves a great deal of risk, including the loss of all or a portion of your investment, as well as emotional distress. All risks, losses and costs associated with investing, including total loss of principal, are your responsibility. The views and opinions expressed in this article are those of the authors and do not necessarily reflect the official policy or position of FXStreet nor its advertisers. The author will not be held responsible for information that is found at the end of links posted on this page.
If not otherwise explicitly mentioned in the body of the article, at the time of writing, the author has no position in any stock mentioned in this article and no business relationship with any company mentioned. The author has not received compensation for writing this article, other than from FXStreet.
FXStreet and the author do not provide personalized recommendations. The author makes no representations as to the accuracy, completeness, or suitability of this information. FXStreet and the author will not be liable for any errors, omissions or any losses, injuries or damages arising from this information and its display or use. Errors and omissions excepted.
The author and FXStreet are not registered investment advisors and nothing in this article is intended to be investment advice.
Recommended Content
Editors’ Picks
Ripple's move above this key level could trigger nearly 50% rally for XRP
Ripple has overcome a critical resistance level and flipped into a support floor on the weekly time frame. This development happened while XRP tightly consolidated for roughly 250 days. Investors can expect XRP to kickstart a massive rally.
Optimism price outlook with nearly $90 million worth of OP tokens flooding markets on Friday
Optimism volatility has shrunk in the ours leading to the network’s cliff unlock. It joins the likes of dYdX and Sui, which have similar events on their calendars. As token unlocks are often considered bearish catalysts, investors should brace for a reaction after the event.
Top 3 Price Prediction Bitcoin, Ethereum, Ripple: Retail watches from the sidelines with a bias for shorts
Bitcoin could clear $73,777 peak as BTC bulls resurface. Ethereum might fall 10% before next leg up as ETH RSI teases with sell signal. XRP could lose $0.6000 threshold as Ripple bulls fail to show up.
Jito price could hit $6 as JTO coils up inside this bullish pattern
Jito price action shows a potential cup and handle formation. Based on theoretical measurement rules, a successful breakout could yield a 56% rally to $6.0. A breakdown of the $3.86 support level would create a lower low for JTO and invalidate the bullish thesis.
Bitcoin: BTC may have recovered, but is it out of the woods?
Bitcoin’s (BTC) upward momentum has shown a significant decline for the past two weeks or so. This development led to a bearish signal on the weekly and an uncertain outlook on the monthly.