Solana price eyes a 20% descent amid a potential bear pennant with validation below $168
- Solana price bears the brunt of a DDOS attack over the past few days.
- SOL price is teasing a bear pennant breakout on the four-hour chart.
- SOL bears target $135 on a downside confirmation as RSI stays bearish.

Solana price tumbled to fresh weekly lows of $161.04 before rebounding to close Saturday at $172.09. SOL bears have regained control below $170 on Sunday, knocking down the rates almost 2% lower on a daily basis.
The so-called Ethereum killer was hit hard over the last past three trading sessions due to a high-profile distributed denial-of-service (DDoS) attack. The renewed downside in SOL price is in sync with a fresh selling wave that has gripped the crypto market.
SOL bulls have failed to pay any heed to the news that Opera browser’s wallet will add support for Solana early next year, a timeline that could place the browser developer on track to beat Brave.
Solana price gears up for a big technical breakdown
Solana’s latest consolidation that follows the previous sell-off carves out a bear pennant formation on the four-hour chart, keeping the sellers cheerful.
If SOL bears manage to find a strong foothold below the rising trendline support at $168 on a four-hourly candlestick closing basis, then it would validate the downside breakout from the bear pennant.
SOL price will eye deeper losses towards the pattern target measured at $135.
The bears will, however, challenge the bullish commitments at the December 11 lows of $161 and the $150 psychological level beforehand.
The 14-day Relative Strength Index (RSI) looks south below the 50.00 level, allowing room for more declines.
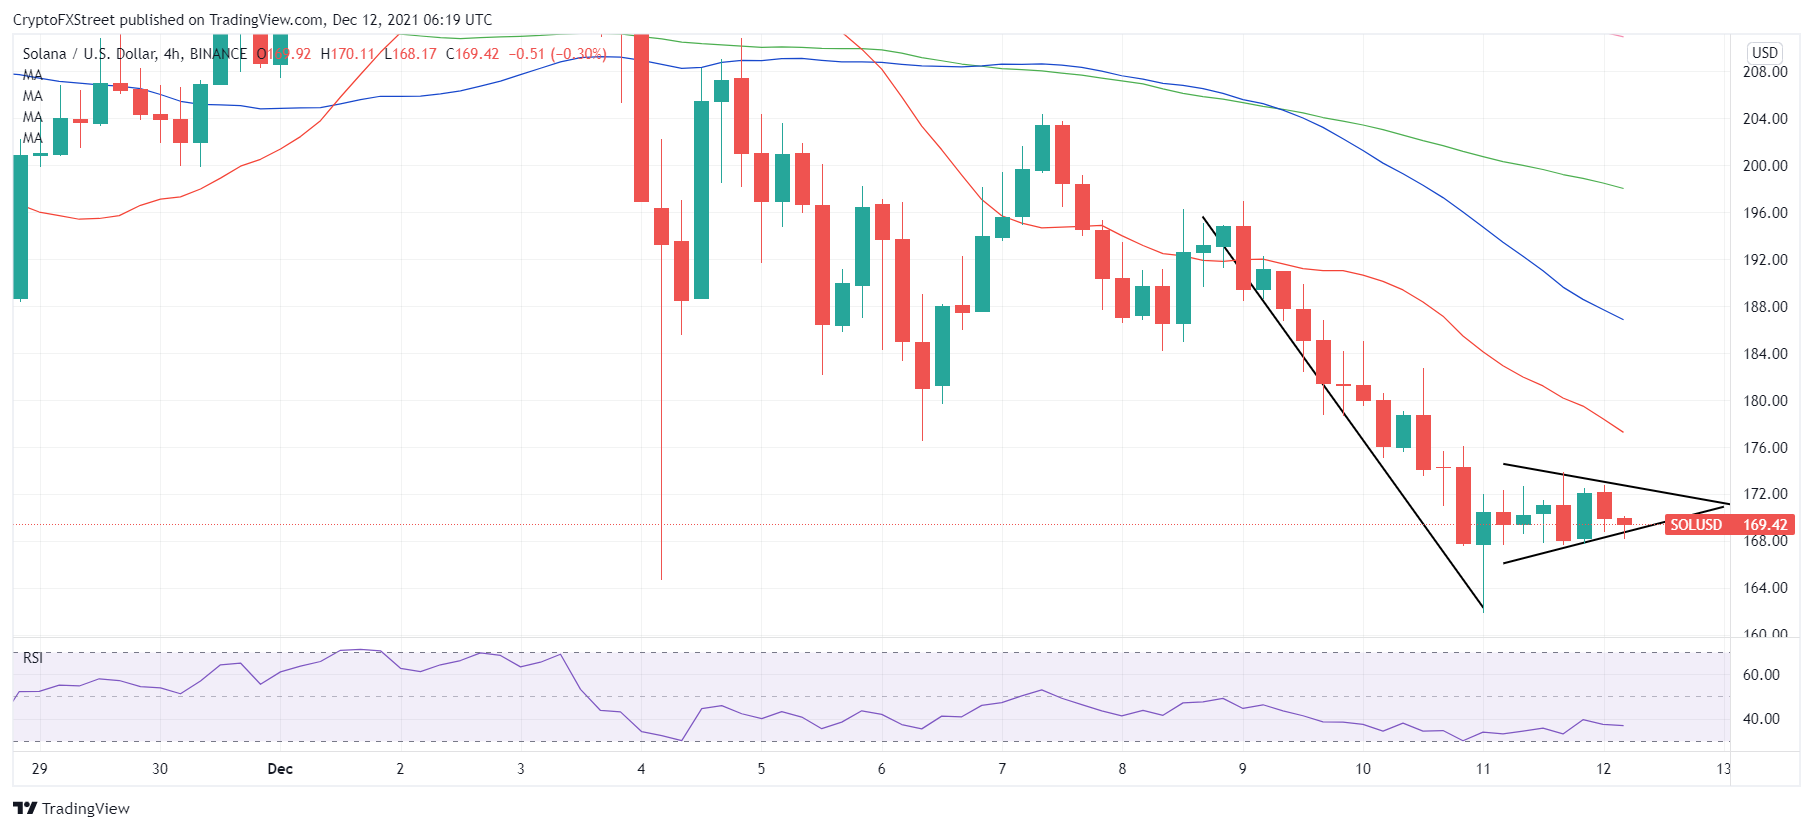
SOL/USD: Four-hour chart
Alternatively, a sustained break above the falling trendline resistance at $173 will invalidate the bearish continuation pattern.
The bearish 21-Simple Moving Average (SMA) at $177 will then challenge the road to recovery, as SOL bulls keep their sights on the $180 mark.
Author

Dhwani Mehta
FXStreet
Residing in Mumbai (India), Dhwani is a Senior Analyst and Manager of the Asian session at FXStreet. She has over 10 years of experience in analyzing and covering the global financial markets, with specialization in Forex and commodities markets.



