Solana price advances despite bearish backdrop
- Solana price jumped over 2% and continued its rally from the beginning of September.
- SOL price sees recovery continuing as the dollar backs off for a third straight day.
- Traders do not be fooled, as this is short-lived, and the bearish outlook has not fundamentally changed.

Solana (SOL) price sees bulls firmly breaking above the 55-day Simple Moving Average (SMA) after they failed to close above it on Monday. Though a telling sign, when viewed within the broader picture, this rally is likely to be short-lived and not yet the one that could spark a big turnaround. Granted, bears are getting weaker, nevertheless, the overall bearish backdrop has not changed as a global recession or implosion of the eurozone is still just around the corner.
SOL price can move higher, the question is for how long
Solana price has risen within this bear cycle several times, as seen in the recent summer rally. However, there is a big element to distillate from this: in the past three months, bears have been able to trade, sometimes even deeply, in oversold areas, whilst at the same time bulls never reached overbought. This still shows a dislocation in the equilibrium between buyers and sellers and points to a more bearish outlook. In addition, the current market conditions still point to a global recession kicking in anytime soon.
Thus, the SOL price can still potentially rally as much as 14% to $43, but that is likely to be as far as it can go in the coming days when considering the Fed rate decision next week and likely communication that the Fed will not be cutting anytime soon, together with a reminder for traders that the Fed’s tightening policy will likely bring inflation substantially lower at the risk of triggering a recession. These two elements have not changed and will probably cause another sell-off soon, with price action falling back to $30.
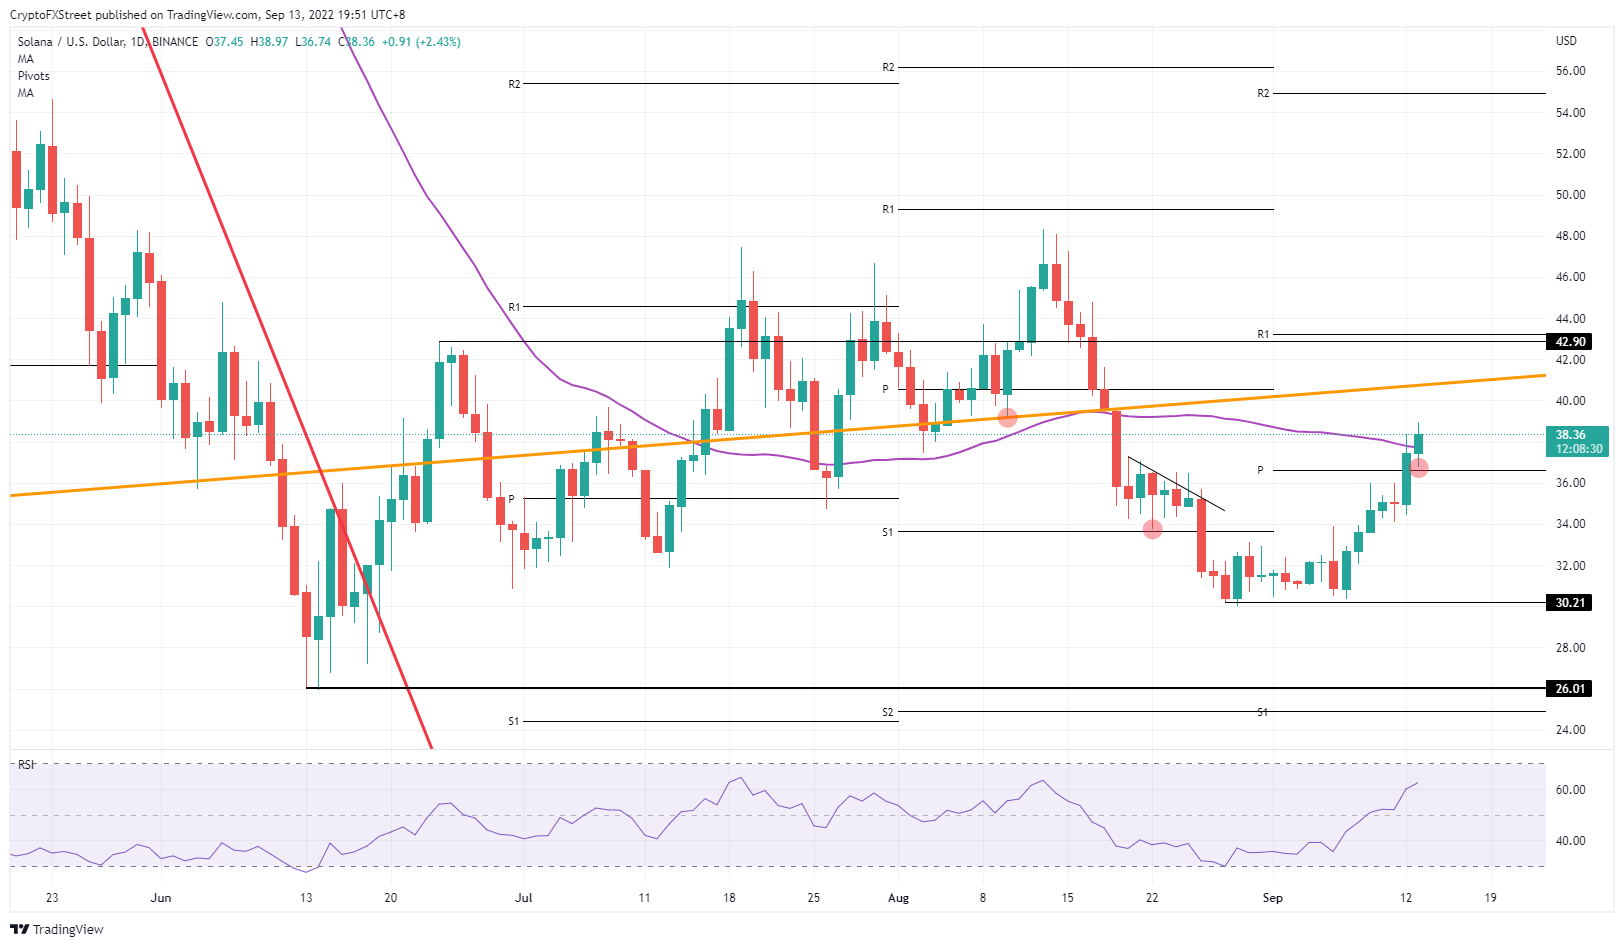
SOL/USD Daily chart
Of course, the bearish background could change if economic data points to a sharp decline in inflation. That would mean that the Fed has done its job adequately and can take its foot off its tighter-monetary-policy pedal. Expect on the back of that, Solana price to spike higher with big multiple percentage jumps towards $55.
Author

Filip Lagaart
FXStreet
Filip Lagaart is a former sales/trader with over 15 years of financial markets expertise under its belt.


