Solana is bouncing – Key trading levels to watch

Solana (SOL) saw a strong bounce today, with price rallying more than 26% off its intraday lows. That type of move naturally catches attention, especially after the kind of downside pressure we’ve seen recently. Even with today’s rebound, it’s important to keep perspective — SOL is still down over 26% on the week. This bounce is meaningful, but it does not erase the larger drawdown that traders are reacting to.
When I step back and look at the chart through a technicals-driven lens, the focus now shifts to clearly defined areas of support and resistance. These are the levels that matter most to me as price continues to stabilize and attempt to reclaim ground.
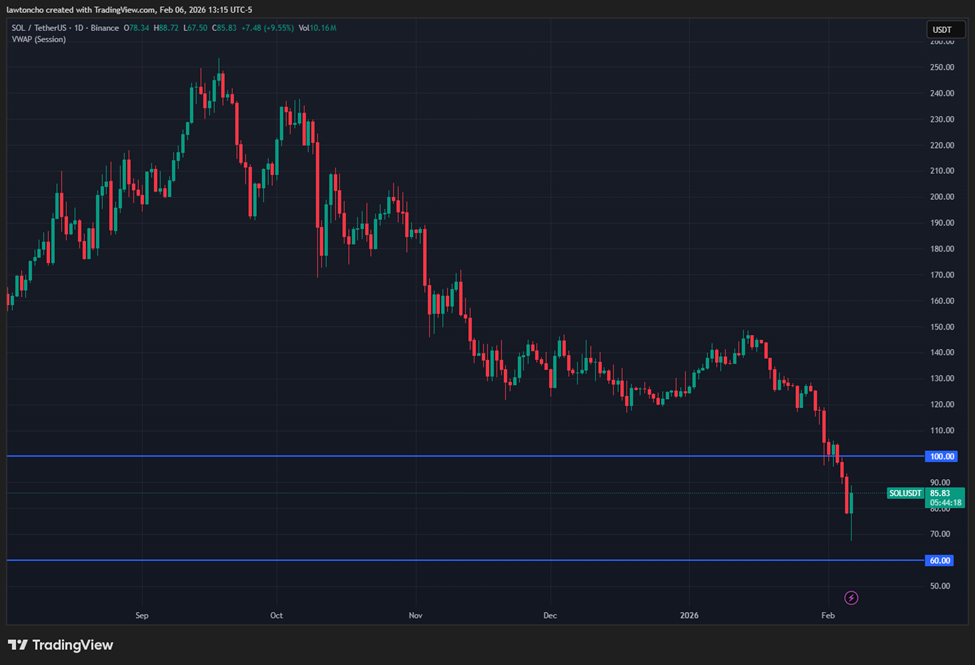
The primary resistance level I am watching is the $100 even number. This is a major psychological level, and historically there has been significant price interaction in and around this zone. From a technicals standpoint, $100 has repeatedly acted as an area where momentum slows and sellers become more active. If SOL pushes back into this region, I would expect resistance to show up and price to react accordingly.
On the downside, the key support level I am focused on is the $60 region. This is another major psychological area that has previously served as both support and resistance. From my perspective, this level represents an important line in the sand for SOL. If price holds above it, the market has a foundation to build from. If it fails, risk increases and volatility can expand quickly.
For context, Solana is a widely followed cryptocurrency that often experiences sharp moves in both directions. Because of that, I approach trading SOL with respect for its volatility and a heavy emphasis on discipline. I don’t try to predict outcomes — I let price interact with key levels and allow the technicals to guide my decisions.
Regardless of direction, proper risk management is essential. Whether trading crypto or stocks, protecting capital comes first. I focus on defined levels, controlled position sizing, and letting the market confirm my thesis rather than forcing one.
Author

Lawton Ho
Verified Investing
A marketing expert sharing his journey to mastering the charts.


