Solana bulls target new all-time highs
- Solana’s price extends its gains on Tuesday after rallying more than 45% in the last two weeks.
- On-chain data paints a bullish picture as SOL’s Open Interest, trading volume and fees reach new record highs.
- The weekly chart shows the breakout of a bullish pattern, with the technical target at a new all-time high of $276.

Solana (SOL) extends its bullish momentum and trades in green at around $242.80 at the time of writing on Tuesday after rallying more than 45% in the last two weeks. On-chain data hints at further gains as SOL’s Open Interest, trading volume, and fees reach new record highs.
The technical charts show a bullish breakout pattern and suggest a continuation of the rally, with a target set for a new all-time high (ATH) of $276.
Reasons for Solana pointing to a fresh all-time high
Solana price has rallied more than 45% since early November as US President-elected Donald Trump’s pro-crypto stance fueled the ongoing rally in cryptocurrencies.
Diving deep into SOL’s on-chain metrics provides a clear picture of a bullish outlook. According to Coinglass data, Solana’s Open Interest (OI) has risen steadily since mid-October and reached its highest level of $5.64 billion on Monday. An increasing OI represents new or additional money entering the market and new buying, which suggests a bullish trend.
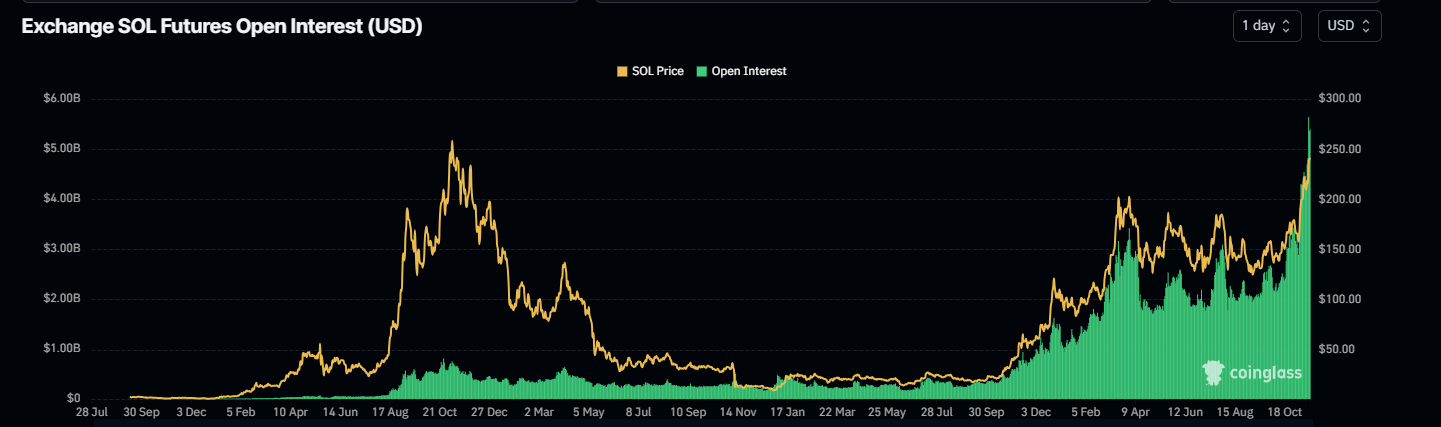
SOL Open Interest chart. Source: Coinglass
Another aspect bolstering the platform’s bullish outlook is a recent surge in traders’ interest and liquidity in the SOL chain. DefiLlama data shows that SOL Chain’s weekly trading volume rose from $18.14 billion in the second week of November to $41.60 billion the next week, the highest since its launch in 2020.
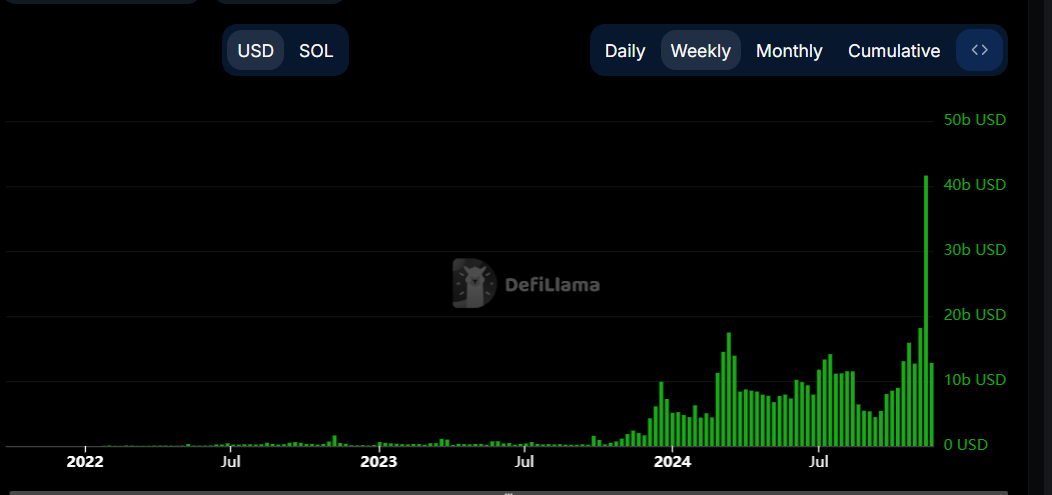
Solana weekly trading volume chart. Source: DefiLlama
DefiLlama data also shows that Solana generated $49.64 million in fees last week, a new all-time high weekly fee, further bolstering the bullish outlook.
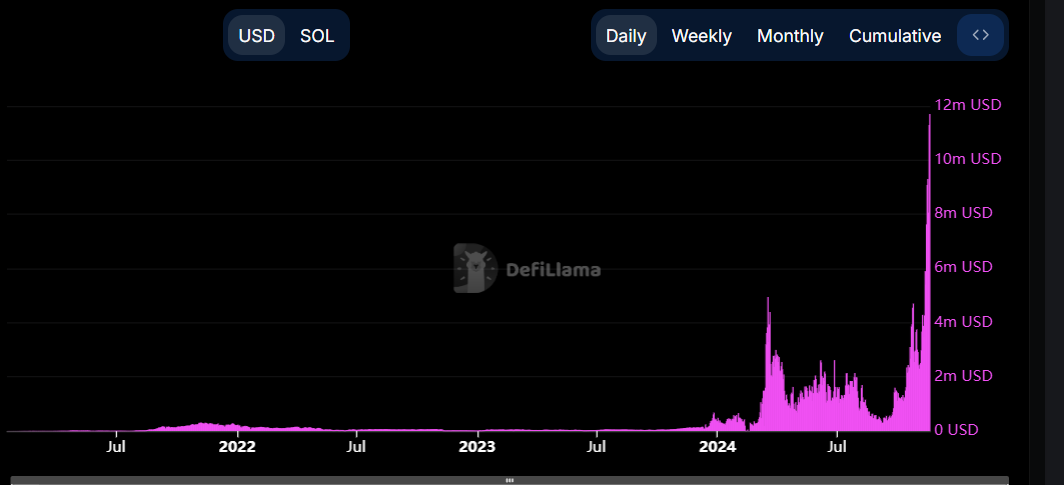
Solana weekly fee chart. Source: DefiLlama
Solana Price Forecast: Projects a new all-time high of $276
Solana’s weekly chart shows that SOL has broken above a downward-sloping parallel channel pattern at around $210.18 and rallied over 45% in two weeks, closing above the yearly high of $210.18 reached on March 18. This pattern is formed by connecting multiple weekly highs and lows from early March to October. A breakout of this pattern, confirmed by a weekly close above the breakout level, favors the bulls. As of this week, SOL’s price extends its gains and trades around $242.80, nearing its all-time high of $259.90.
If Solana continues its upward momentum, the pattern’s technical target (obtained by measuring the distance between the two trendlines and extrapolating it higher) projects a target of a new ATH of $276.55.
The Relative Strength Index (RSI) momentum indicator on the weekly chart reads 69, indicating that bullish momentum is gaining traction while still below overbought conditions.
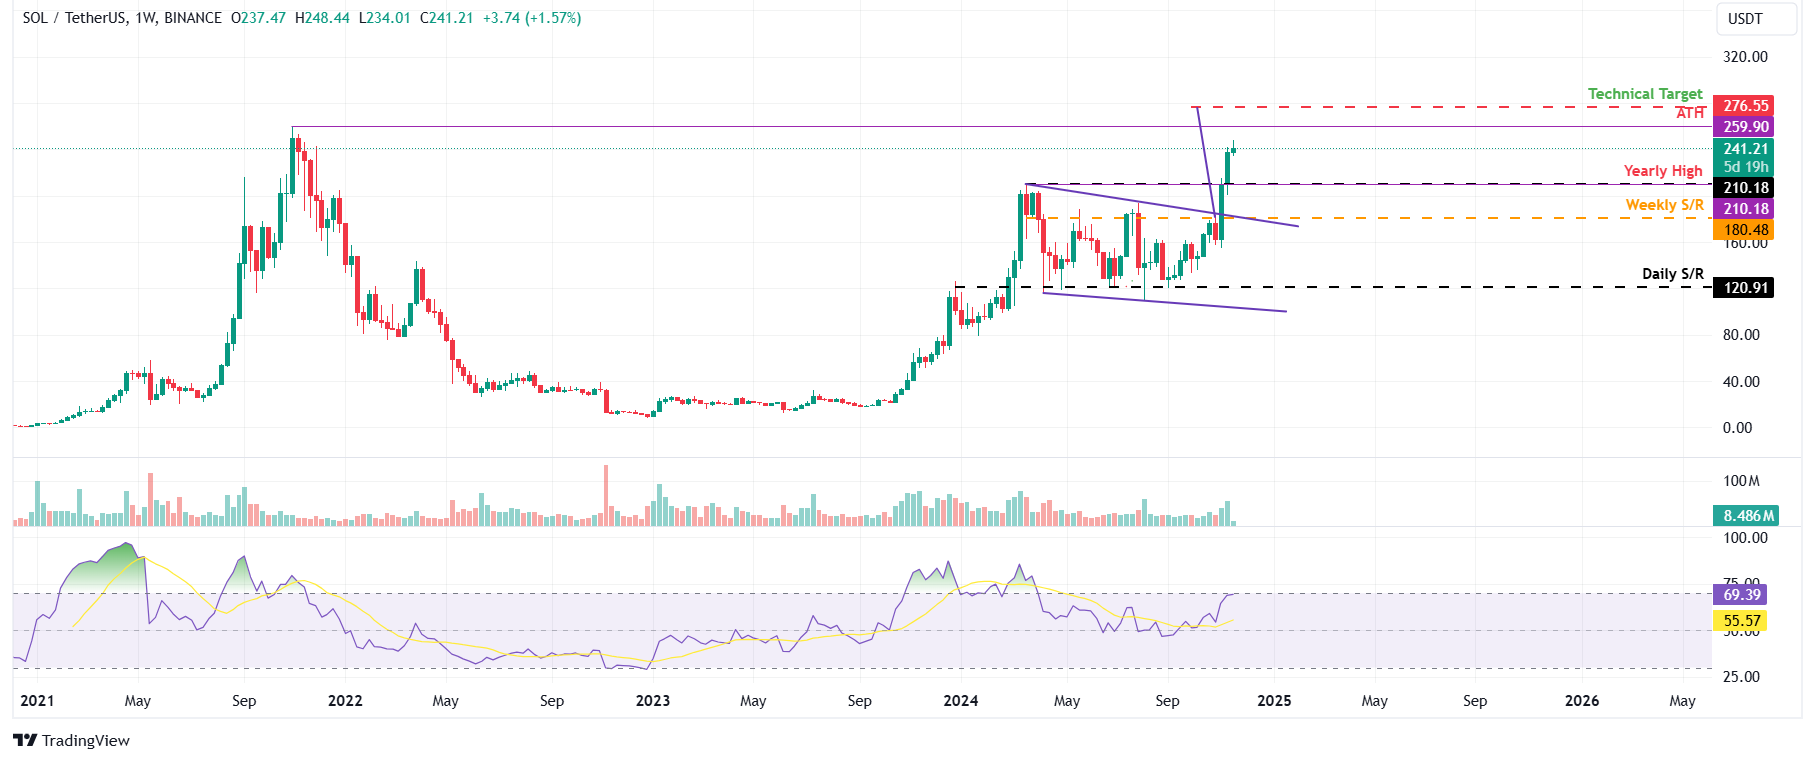
SOL/USDT weekly chart
Author

Manish Chhetri
FXStreet
Manish Chhetri is a crypto specialist with over four years of experience in the cryptocurrency industry.


