Solana price needs to crack this key level as SOL bulls eye an upswing towards $200
- Solana price is teasing a falling wedge breakout on the daily chart.
- SOL bulls need to find acceptance above $148 to initiate a fresh upswing.
- The downside remains cushioned by the 50-DMA at 110.50, bullish RSI.

Solana is seeing some buying resurgence on Saturday, as it reverses Friday’s temporary drop to near the $127.50 region.
SOL bears fought back the control a day before, tracking the downbeat tone across the crypto market, in light of the blow from China. The People’s Bank of China (PBOC) issued a notice, imposing a ban on all crypto transactions as it will be considered illicit financial activity.
At the time of writing, SOL price has recaptured the $140 mark, adding about 1% on the day, although remains on track to book the second straight weekly loss.
Solana price prepares for a big technical breakout
Looking at Solana’s daily chart, SOL bulls are challenging the falling trendline resistance at $148 after two failed attempts earlier this week.
If SOL bulls manage to find a strong foothold above the latter on a daily closing basis, then it would confirm an upside breakout from a falling wedge formation.
SOL price has been trending within the bullish continuation pattern ever since it recorded all-time highs at $221.38 on September 9. The price has been forming lower highs and lower lows, carving out a falling wedge pattern on the said timeframe.
The 14-day Relative Strength Index (RSI) inches higher above the midline, allowing room for more upside.
Therefore, the wedge breakout would open doors for a rally towards the $200 mark. Ahead of that the horizontal 21-Daily Moving Average (DMA) at $159.40 could test the bearish commitments.
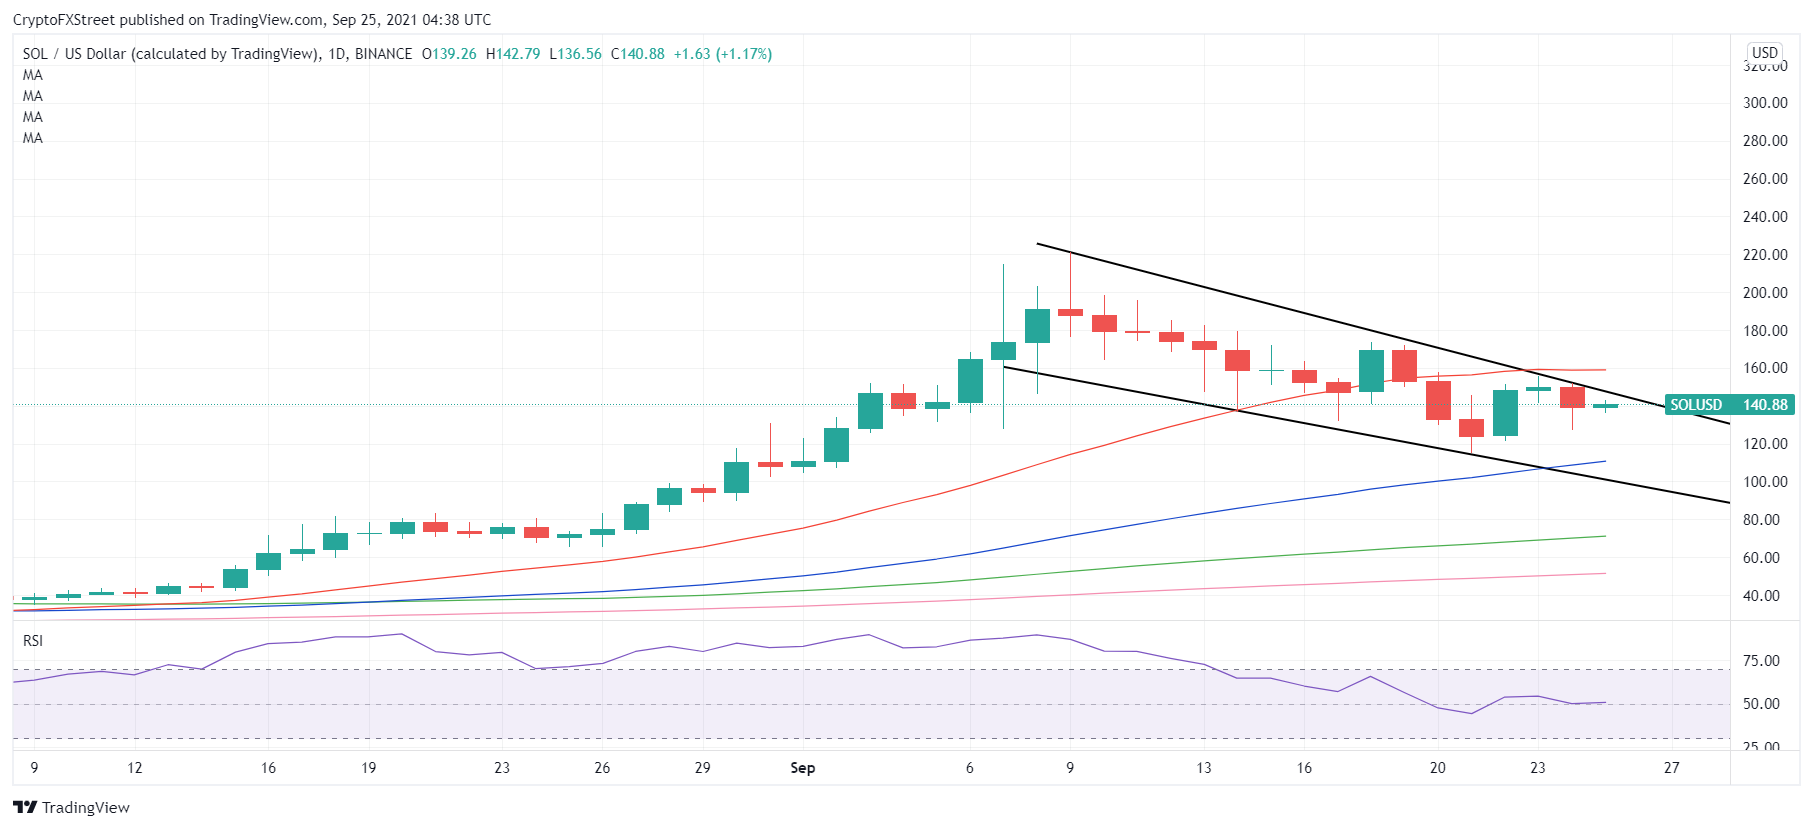
SOL/USD: Daily chart
Should the wedge hurdle emerge as a tough nut to crack SOL price could see a retracement towards the upwards-sloping 50-DMA at $110.50.
The next downside target is seen at falling trendline (wedge) support at $100.60, below which a fresh downswing could kick in towards the mildly bullish 100-DMA at $71.54.
Author

Dhwani Mehta
FXStreet
Residing in Mumbai (India), Dhwani is a Senior Analyst and Manager of the Asian session at FXStreet. She has over 10 years of experience in analyzing and covering the global financial markets, with specialization in Forex and commodities markets.


