Shiba Inu pulls a bear trap but needs to watch out for next week
- Shiba Inu is trying to squeeze bears out of their positions with a positive weekly close.
- SHIB price sees bulls trading back above the 55-day Simple Moving Average.
- Bulls could risk a firm rejection and fade back to $0.00001000.
Shiba Inu (SHIB) price has paired back incurred losses from last week and is trying to squeeze out bulls that jumped in on the drop below the 55-day Simple Moving Average (SMA) at the end of last week. With that bear trap, bulls are trying to lengthen the pain trade a little bit more by trying to trade at higher prices. But bulls need to watch out as a weekly rejection could be occurring at $0.00001276, which could trip price action back below the 55-day SMA and another leg lower in the coming weeks.
SHIB price sees bears and bulls playing tit for tat
Shiba Inu price is hard to define or tell whether it is playing a bull trap or a bear trap. Either way, it seems that bears will pull at the long end of the straw and will have their way if bulls stay unable to break the high of the last week of August at $0.00001492. A fade could be kicking in soon, which could already be next week, as bulls look unable to eke out more gains and print new gains for this week.
SHIB price is thus set to undergo rejection and slip further away into next week as markets will focus back to what counts: central banks. With another central bank, the ECB, lined up next week to hike 75bp as the US Fed, more tightening will be triggered, this time on the European mainland. That means another big block of investors cashing in and draining their cash from cryptocurrencies, with SHIB price set to slip back to $0.00001000 with the new monthly S1 support for September as a platform.
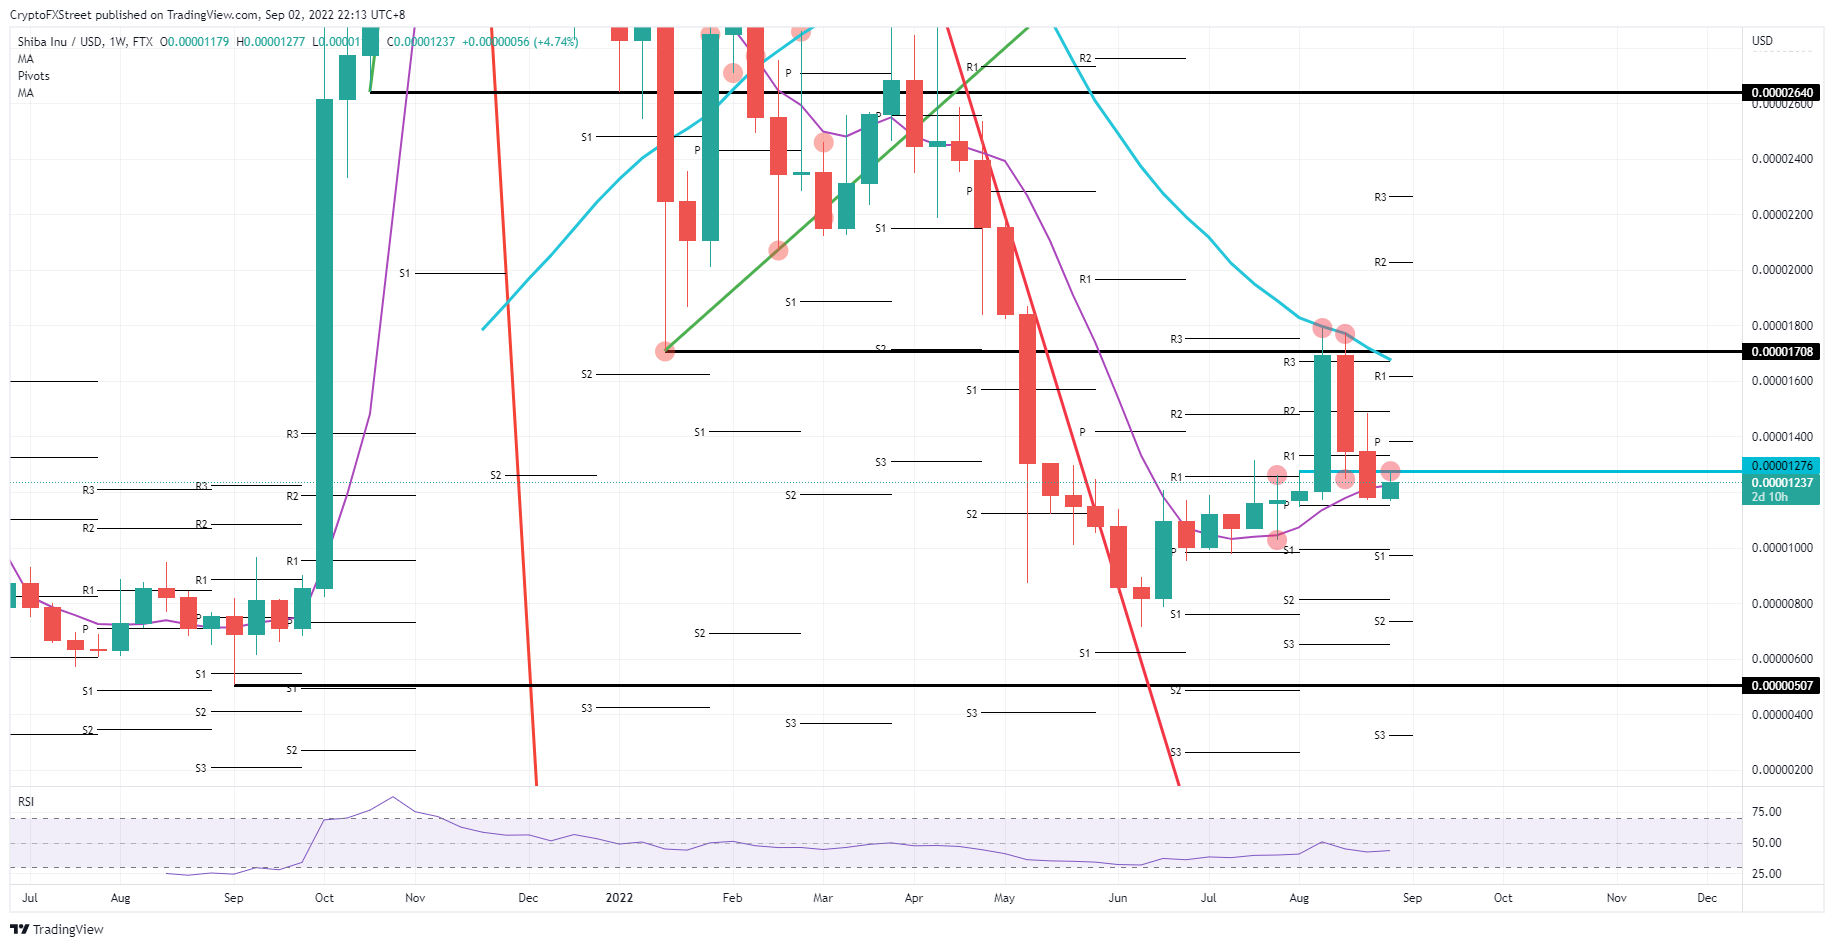
SHIB/USD Weekly chart
With the weekly close above the 55-day SMA, bulls could still be more stubborn as thought and could be seen setting forward their attack on that $0.00001276 level. Should next week be closed above that level, expect to see a third consecutive winning streak with September becoming an overall profitable month and probably even ticking $0.00001600. That would be a 30% gain spread over roughly three weeks.
Author

Filip Lagaart
FXStreet
Filip Lagaart is a former sales/trader with over 15 years of financial markets expertise under its belt.


