Shiba Inu Price Prediction: SHIB may reward patience with an 80% return
- Shiba Inu price currently building the right shoulder of a multi-week inverse head-and-shoulders pattern.
- SHIB 200 four-hour SMA has flattened, reflecting a decline in downside momentum.
- Rookie cryptocurrency requires a 38% gain to trigger the new governing pattern.
Shiba Inu price did test the May 19 low again earlier this week but did rebound before testing the June 11 low, establishing the low point of a potential inverse head-and-shoulders pattern. The ongoing rebound has been tentative, suggesting a mild pullback before starting a rally towards the pattern’s neckline. With two four-hour moving averages haunting price, practicing patience and letting the SHIB right shoulder develop is advisable.
Shiba Inu price still lacks the volatility to formalize a march higher
Shiba Inu price collapsed over 40% from the June 15 high of $0.00000986 to the June 22 low of $0.00000560 after being overwhelmed by the selling that gripped the cryptocurrency complex. SHIB did manage to hold the June 11 low, establishing a point to build the right shoulder of the visible inverse head-and-shoulders pattern.
The measured move target of the pattern is $0.00001730, equating to an 82% gain from the neckline and nearly touching the 38.2% Fibonacci retracement level of the May crash at $0.00001754. To reach the neckline at $0.00000945, Shiba Inu price will need to rally close to 40%, overcoming the resistance established by the declining 50 four-hour SMA at $0.00000731 and the 200 four-hour SMA at $0.00000792. It is a long wait for impatient SHIB investors, but it will enhance the trade’s probability of success.
A breakout above the neckline by Shiba Inu price would meet resistance at $0.00001048 and then the merger of the May 24 high at $0.00001204 with the May 20 high at $0.00001214. There is no more meaningful resistance for SHIB until the measured move target of $0.00001730.
It is important to note that other cryptocurrencies formed inverse head-and-shoulders patterns, albeit with a larger footprint, before delivering significant investment returns to investors, such as XRP and ZIL.
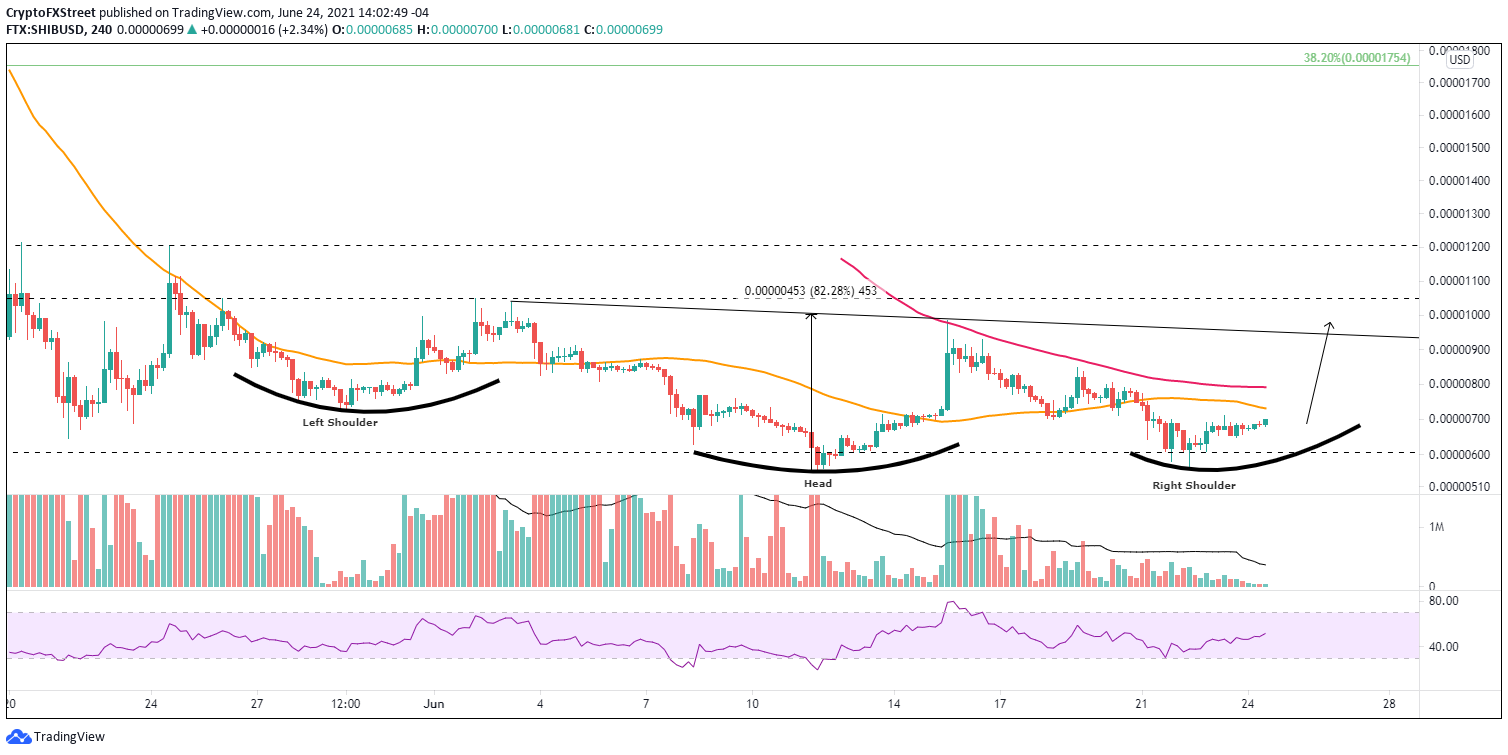
SHIB/USD 4-hour chart
Today, the rebound from the right shoulder low appears corrective, wedging higher on very light volume, possibly indicating that Shiba Inu price weakness has not passed. SHIB may need to revisit the shoulder low at $0.00000560 before staging a purposeful rally towards the pattern’s neckline if that is the case.
A decline below the head’s low at $0.00000550 would void the price structure, exposing Shiba Inu price to notable losses. It is a potential outcome for SHIB should the cryptocurrency market suffer a new wave of selling.
Author

Sheldon McIntyre, CMT
Independent Analyst
Sheldon has 24 years of investment experience holding various positions in companies based in the United States and Chile. His core competencies include BRIC and G-10 equity markets, swing and position trading and technical analysis.


