Shiba Inu price must hold above $0.000042 to avoid catastrophic outlook
- Shiba Inu price lost over 4.60% to trade at $0.000042 amid fake giveaway scams.
- SHIB has formed a descending triangle pattern over the past few days.
- A bearish engulfing candle near $0.000044 level is signaling that sellers have the upper hand.
Shiba Inu price has been consolidating since Nov. 18, forming a bearish pattern on its 4-hour chart. A spike in selling pressure could push SHIB even lower despite the significant losses already incurred. It will all depend on whether a critical support level can hold.
Shiba Inu price looks ready to break $0.000042 to the downside
Shina Inu technical outlook remains bearish as the token holds below the 13 and 21-day exponential moving averages. These two EMAs provide resistance at $0.000044 level, and the formation of candles below these lines is indicative of a downward trend.
At the moment, the 12th-largest cryptocurrency by market cap is trading with a strong bearish bias. SHIB has formed a descending triangle where the pattern’s x-axis is acting as support at $0.000042.
Typically, descending triangle patterns tend to exhibit a bearish breakout. If this were to happen, an increase in selling pressure around the current price levels could open additional room for Shiba Inu price to drop by 20% towards $0.000035.
A series of technical indicators such as the relative strength index or RSI adds credence to a pessimistic outlook as it hovers around 42. Additionally, SHIB has closed a bearish engulfing candle indicating that sellers remain dominant.
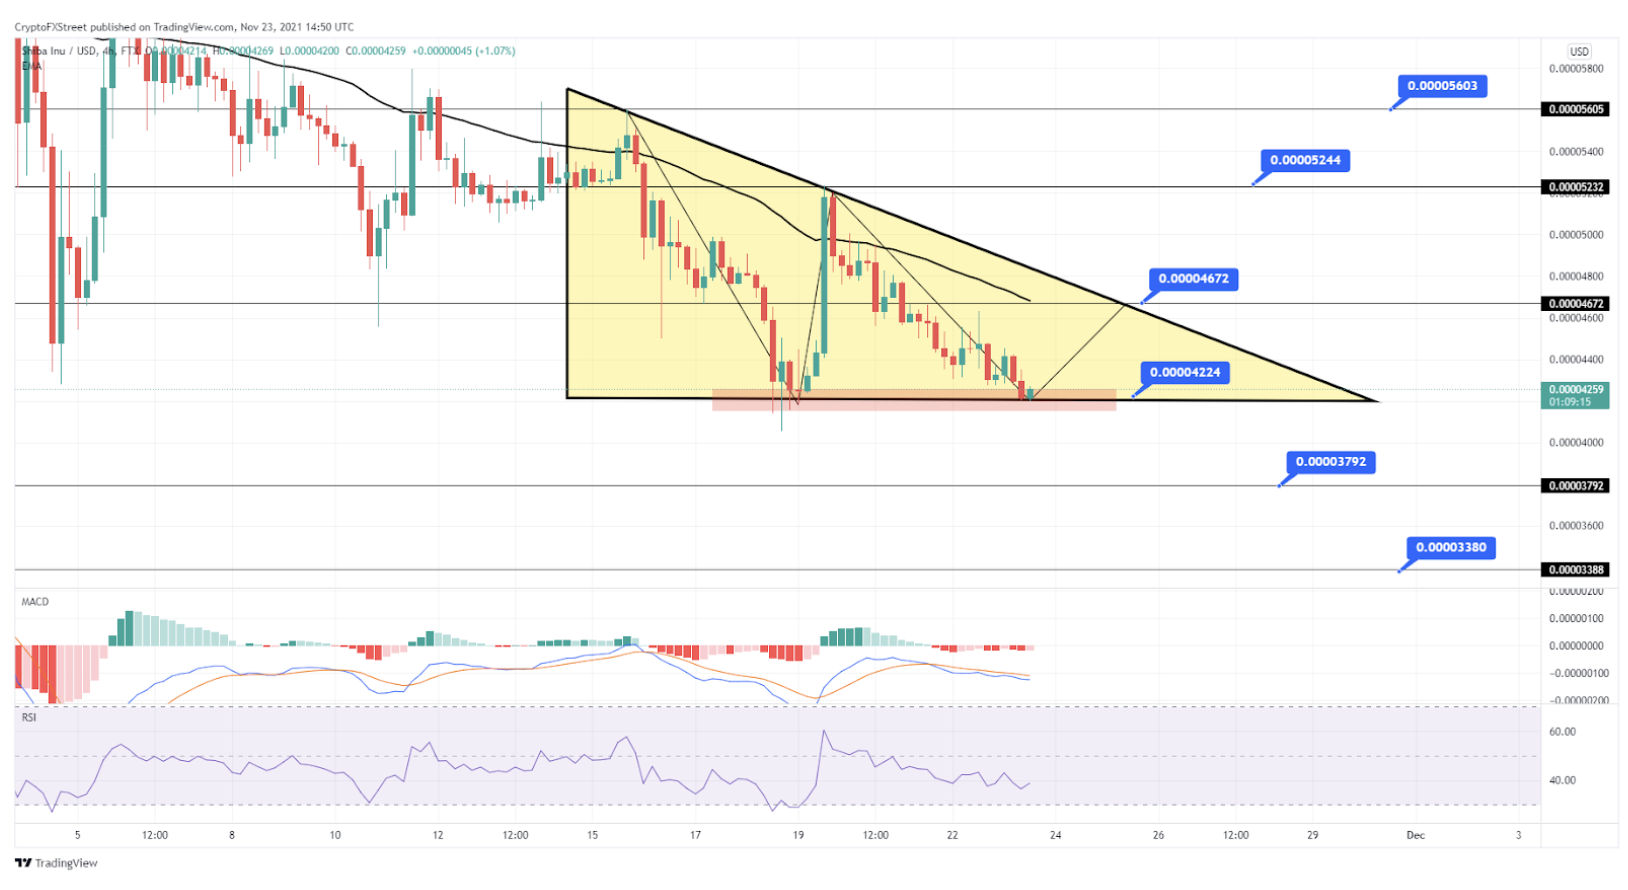
Shiba Inu (SHIB) 4-hour timeframe - Descending Triangle Pattern
Still, Shiba Inu can shrug off the bears if it manages to stay above $0.000042. Holding above such a crucial level of support can encourage traders to open long positions, catapulting SHIB to the $0.000044 resistance level. If the upward pressure is strong enough for the meme coin to slice through $0.000044, an upswing to $0.000052 or $0.0000056 can be expected.
Author
FXStreet Team
FXStreet
Composed of a group of economic journalists and FX experts, the FXStreet content team produces and oversees all content published on FXStreet. It provides a purely journalistic approach to the Forex market.


