• Shiba Inu price broke through the 78.6% Fibonacci level but failed to close above.
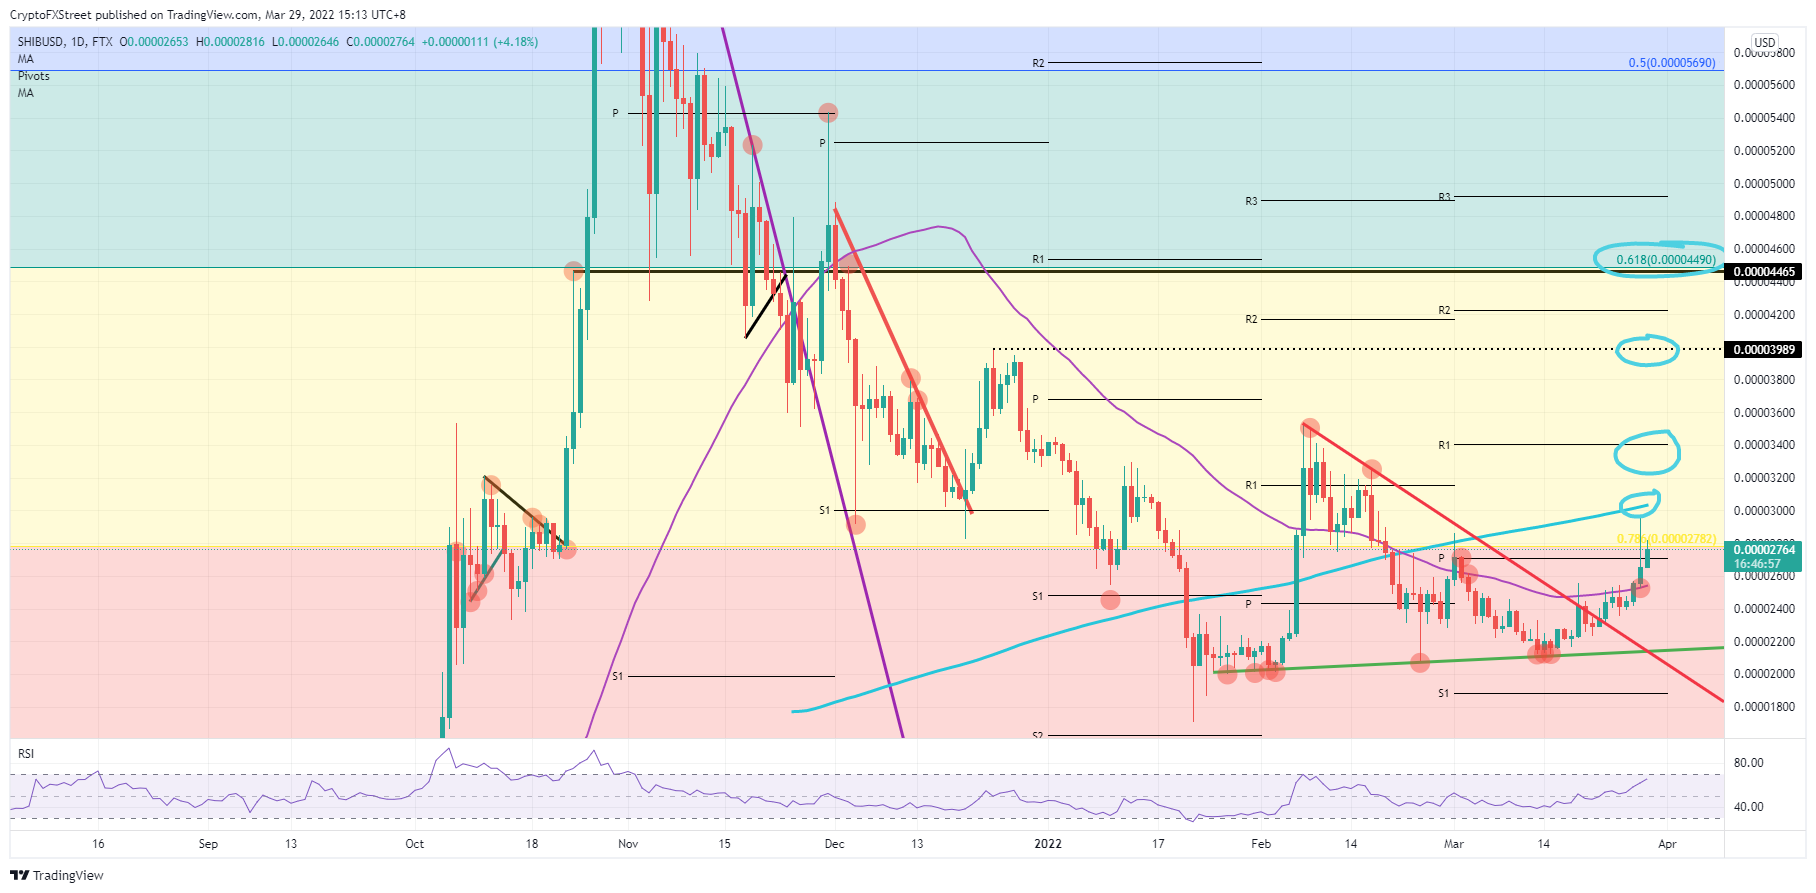
  • SHIB price breaks back above the monthly pivot in early trading.
  • Expect to see an attempt for $0.00003000 near-term, with a longer-term target set at $0.00004490.

Shiba Inu (SHIB) price saw bulls taking the lead on Monday by using the 55-day Simple Moving Average (SMA) handle as an entry point that resulted in the price shooting up to the 200-day SMA of $0.00003000, but bulls were unable to perform a daily close above this level. In the ASIA PAC session this morning, SHIB price is knocking at the door of the 78.6% Fibonacci level at $0.00002782, which opens the path towards 61.8% Fibonacci level at $0.00004490, meaning a whopping 65% gain is within reach. In order to achieve that target, a daily close above the 78.6% Fibonacci should be enough to rally at a tiered pace.

Also read: AMC stock finally begins stalling, so it may be time to book profits

Shiba Inu price set for a phased rally

Shiba Inu price will swing back to $0.00003000, which coincides with the 200-day SMA. Technically, this is the most significant technical hurdle to overcome if investors want to book 65% of gains in this spring rally. In case a daily close above here is reached, a significant bullish signal will be delivered to the markets, which will trigger more investors and day traders to the price action to ramp it further up, resulting in crossing some grounds quite quickly to $0.00003400, which falls in line with the monthly R1.

SHIB price then has only one element that could keep it from popping further upwards to $0.00004465, and that is the $0.00003989 level which coincides with the high of December 24. Not only would that mean that SHIB price is printing new highs for the year, but in the meantime will have wholly reversed the winter downtrend that slammed price action with the Ukraine war. Only a 10% jump remains to hit the 61.8% Fibonacci level and will see a broad and significant fade to the downside as investors will want to book gains and cash in there.

SHIB/USD daily chart

SHIB/USD daily chart

Risk to the downside comes on Tuesday with talks in Turkey between Russia and Ukraine that could provide a setback. Both parties are still talking, but should one party walk away from negotiations, that would mean a big step back for markets as investors have been front-running a positive outcome since last week, with the expectations bar set high. A collapse of SHIB price could result with Shiba Inu price dropping back to $0.00002200, losing support of that 55-day SMA and rebalancing around that green ascending trendline marked up since January 25


Information on these pages contains forward-looking statements that involve risks and uncertainties. Markets and instruments profiled on this page are for informational purposes only and should not in any way come across as a recommendation to buy or sell in these assets. You should do your own thorough research before making any investment decisions. FXStreet does not in any way guarantee that this information is free from mistakes, errors, or material misstatements. It also does not guarantee that this information is of a timely nature. Investing in Open Markets involves a great deal of risk, including the loss of all or a portion of your investment, as well as emotional distress. All risks, losses and costs associated with investing, including total loss of principal, are your responsibility. The views and opinions expressed in this article are those of the authors and do not necessarily reflect the official policy or position of FXStreet nor its advertisers. The author will not be held responsible for information that is found at the end of links posted on this page.

If not otherwise explicitly mentioned in the body of the article, at the time of writing, the author has no position in any stock mentioned in this article and no business relationship with any company mentioned. The author has not received compensation for writing this article, other than from FXStreet.

FXStreet and the author do not provide personalized recommendations. The author makes no representations as to the accuracy, completeness, or suitability of this information. FXStreet and the author will not be liable for any errors, omissions or any losses, injuries or damages arising from this information and its display or use. Errors and omissions excepted.

The author and FXStreet are not registered investment advisors and nothing in this article is intended to be investment advice.

Join Telegram

Recommended content


Recommended Content

Editors’ Picks

Why crypto may see a recovery right before or shortly after Bitcoin halving

Why crypto may see a recovery right before or shortly after Bitcoin halving

Cryptocurrency market is bleeding, with Bitcoin price leading altcoins south in a broader market crash. The elevated risk levels have bulls sitting on their hands, but analysts from Santiment say this bleed may only be cauterized right before or shortly after the halving.

More Cryptocurrencies News

Manta Network price braces for volatility as $44 million worth of MANTA is due to flood markets

Manta Network price braces for volatility as $44 million worth of MANTA is due to flood markets

Manta Network (MANTA) price was not spared from the broader market crash instigated by a weakness in the Bitcoin (BTC) market. While analysts call a bottoming out in the BTC price, the Web3 modular ecosystem token could suffer further impact.

More Manta Network News

Bitcoin price uptrend to continue post-halving, Bernstein report says as traders remain in disarray

Bitcoin price uptrend to continue post-halving, Bernstein report says as traders remain in disarray

Bitcoin is dropping amid elevated risk levels in the market. It comes as traders count hours to the much-anticipated halving event. Amid the market lull, experts say we may not see a rally until after the halving. 

More Bitcoin News

OMNI post nearly 50% loss after airdrop and exchange listing

OMNI post nearly 50% loss after airdrop and exchange listing

Omni network (OMNI) lost nearly 50% of its value on Wednesday after investors dumped the token following its listing on top crypto exchanges. A potential reason for the crash may be due to the wider crypto market slump.

More Omni Network News

Bitcoin: BTC’s rangebound movement leaves traders confused

Bitcoin: BTC’s rangebound movement leaves traders confused

Bitcoin (BTC) price has been hovering around the $70,000 psychological level for a few weeks, resulting in a rangebound movement. This development could lead to a massive liquidation on either side before a directional move is established. 

Read full analysis

BTC

ETH

XRP