Shiba Inu Price Forecast: SHIB headlines a 40% opportunity
- Shiba Inu price reversing earlier gains of nearly 20% as retail investors use strength to trim positions.
- SHIB strikes support at the instructive May 19 low of $0.00000607.
- Daily Relative Strength Index (RSI) nearly triggered an extreme oversold condition.
Shiba Inu price has granted an interesting experience for investors, plotting different patterns with accurate entry prices only to reverse and pursue new correction lows. Today’s advance may be the beginning of a sustainable opportunity. Still, it is imperative to resist the chase based on historical precedent and the rapidly deteriorating intra-day price action, as SHIB has not accomplished anything yet. Better to opt for a gradual accumulation of the meme token as it proves itself.
Shiba Inu price rebound still encounters a challenging environment
Shiba Inu price structure has morphed from an inverse head-and-shoulders pattern into a descending parallel channel with the upper trend line at $0.00000883 and the lower trend line at $0.00000447, representing a range of over 90% from bottom to top.
The 50-day simple moving average (SMA) at $0.00000763 is a key Shiba Inu price level that may restrict a meaningful rally from current prices, as the indicator has been a weight on SHIB since its appearance on June 28. Currently, SHIB is trading about 20% below the moving average.
To explore better outcomes, Shiba Inu price needs to fortify the support designated by the May 19 low of $0.00000607, potentially leading to a significant rally like in mid-June and late-June, each measuring over 50%. Not a guaranteed outcome with the lower trend line of the descending parallel channel at $0.00000447 generating a magnet effect for price.
Supportive of a continuation of today’s rebound is the near oversold reading yesterday, suggesting that selling pressure in SHIB may have been exhausted, at least in the short term.
Overall, if Shiba Inu price remains firm at the May 19 low, SHIB investors can initiate a pilot position with yesterday’s low of $0.00000570, serving as the stop/loss. It provides room for daily fluctuations but prevents getting caught in a quick sell-off to the lower trend line, which would be a 24% loss from yesterday’s low.
A follow-through on today’s gains will encounter strict resistance at the 50-day SMA at $0.00000763 before a test of the upper trend line of the descending parallel channel at $0.00000883, yielding a return of almost 40% from the current Shiba Inu price.
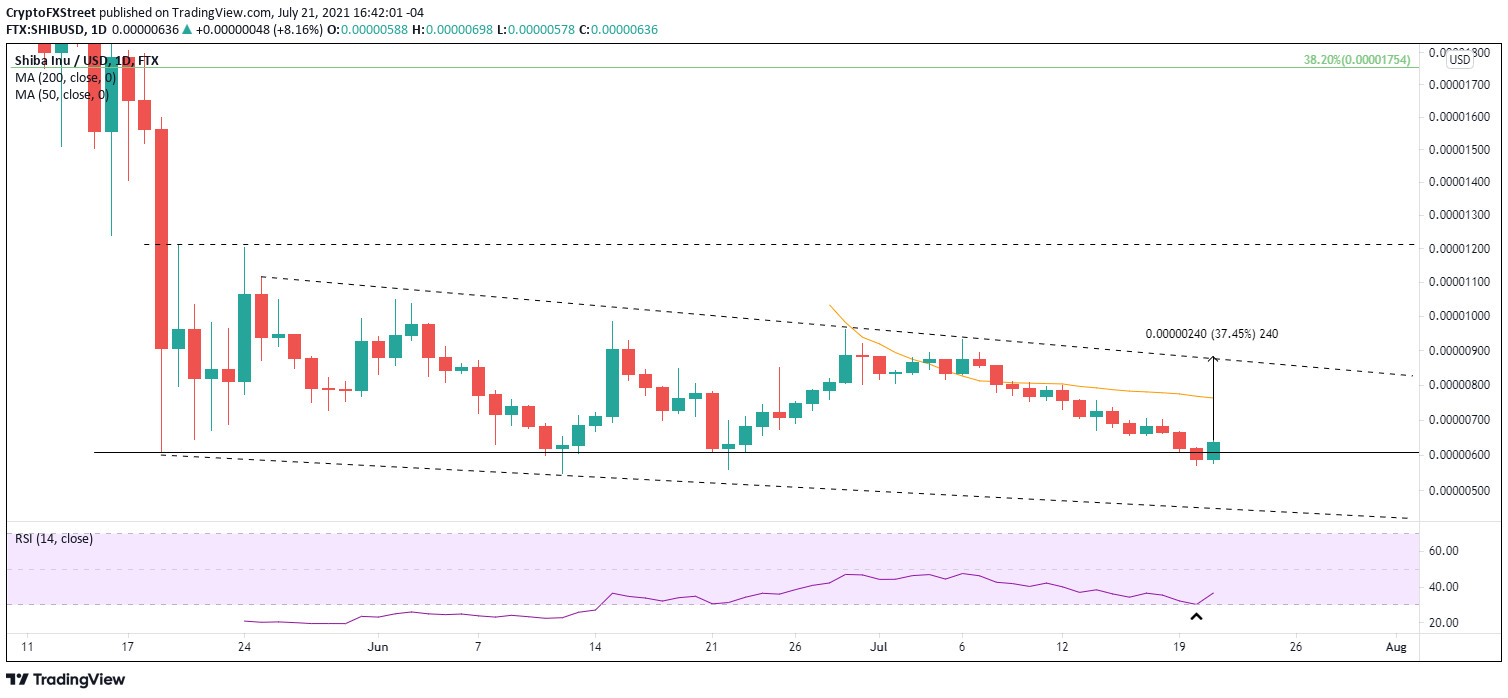
SHIB/USD daily chart
Shiba Inu price risk should be limited to around $0.00000447. Due to the short SHIB price history, it is difficult to form conclusive support levels if selling pressure continues. The key is to respect yesterday’s low as a stop/loss, thereby avoiding being caught in an uncertain situation.
Today’s Shiba Inu price gain will make the news roll, but it does not alter the challenging environment for the digital asset or the cryptocurrency market. Instead, use the opportunity for a pilot buy and then seek follow-through and conviction in SHIB before chasing prices further.
Here, FXStreet's analysts evaluate where SHIB could be heading next as it seems bound for higher highs.
Author

Sheldon McIntyre, CMT
Independent Analyst
Sheldon has 24 years of investment experience holding various positions in companies based in the United States and Chile. His core competencies include BRIC and G-10 equity markets, swing and position trading and technical analysis.


