Shiba Inu Price Forecast: SHIB gets closer to a 50% rebound
- Shibu Inu price forming a new symmetrical triangle on the four-hour chart.
- SHIB has closed with consecutive inside days, suggesting investors should be ready for a notable price move soon.
- A stable to strong cryptocurrency market does hint at a bullish resolution, but investors are best served to wait for it to happen.
The Shiba Inu price has fallen 85% from the May 10 high of $0.00003999 to the May 19 low of $0.00000607. The dog-themed token is now defining a symmetrical triangle pattern on the four-chart that is near completion. Over 75% of symmetrical triangle patterns are continuation patterns, so probabilities dictate that SHIB should resolve the pattern to the downside shortly.
Shiba Inu price compression leads to price expansion
The symmetrical triangle pattern, sometimes referred to as a coil, tends to form during a trend as a continuation pattern. The work by Edwards and Magee, “Technical Analysis of Stock Trends” (1948), suggests that 75% of symmetrical triangles are continuation patterns and the remaining are reversals. The reversal patterns are challenging to analyze and frequently have false breakouts.
The symmetrical triangle pattern is contained by at least two reaction highs and two reaction lows. When the lines are connected, they converge as they are extended, creating a symmetrical triangle.
Since May 19, Shiba Inu price has been quietly forming a symmetrical triangle with three reaction lows and three reaction highs. At the time of writing ($0.00000908), SHIB is initiating an attempt to break out to the upside. Based on the widest distance of the triangle and applied to the breakout point, the measured move target is $0.00001337, or a gain of 50%.
The 50% rally would elevate Shiba Inu price beyond the 50 four-hour simple moving average (SMA) at $0.00001119 and the 23.6% Fibonacci retracement of the SHIB decline from May 10 at $0.00001325.
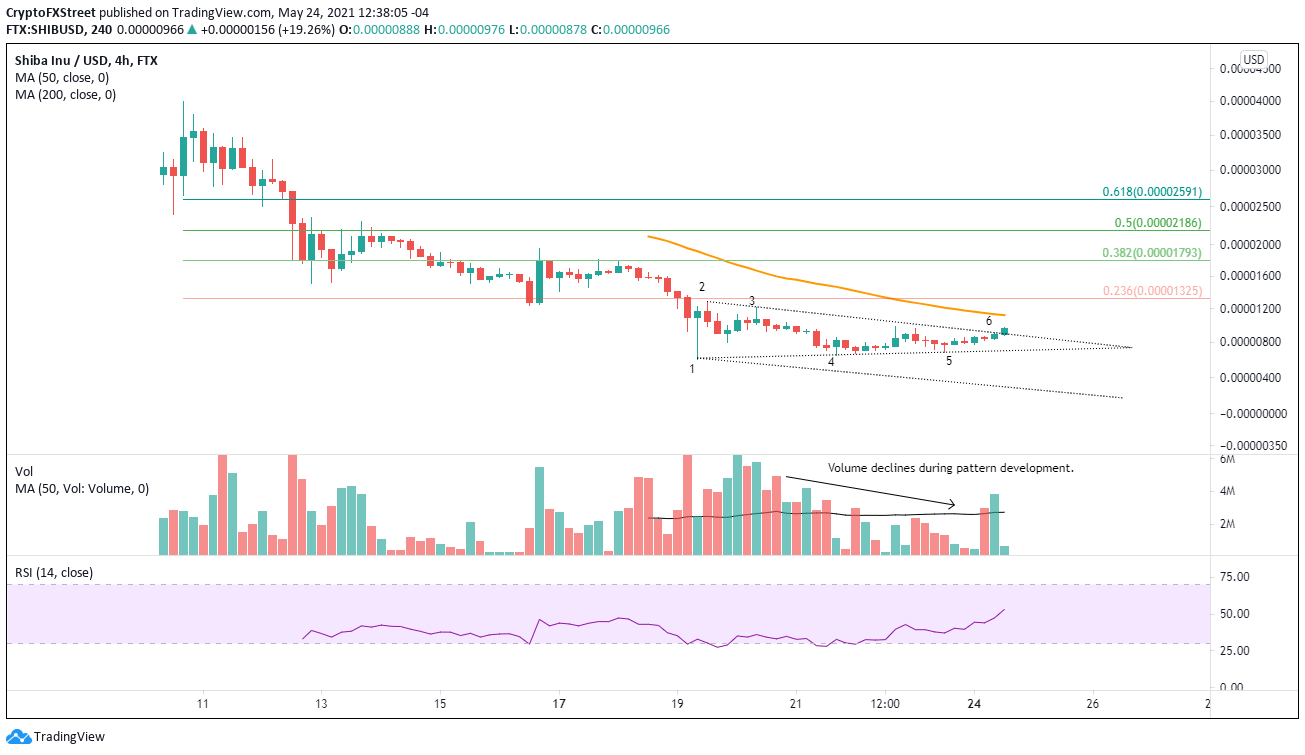
SHIB/USD 4-hour chart
As upside breakouts are rare and prone to failure, it is crucial to consider the downside. The measure move target for Shiba Inu price is $0.00000347 based on the widest distance of the triangle. An alternative way is to establish a parallel line to the triangle’s upper trend line which yields a measured move target of $0.00000287, or a 58% decline from the triangle’s lower trend line.
At this moment, the upward resolution of the SHIB triangle signifies a potential break from the 85% decline since May 10. Investors should consider initiating a position on the Shiba Inu price breakout but do so in consideration of the probabilities mentioned above and with a relatively tight stop loss. Moreover, it is important not to overlook the consecutive inside days on the bar chart. An important quote to keep in mind when understanding price action is that “price contraction leads to price expansion.”
Author

Sheldon McIntyre, CMT
Independent Analyst
Sheldon has 24 years of investment experience holding various positions in companies based in the United States and Chile. His core competencies include BRIC and G-10 equity markets, swing and position trading and technical analysis.


