- Shiba Inu price is down almost 50% since the February 4 high of $0.00001575 and -16% since May started.
- SHIB could drop an additional 5% as bears continue overpowering the bulls.
- The latest bearishness comes in the wake of community conflicts, stalling SHIB in the consolidation phase.
- Accordingly, large transactions are down almost 80% in the last month, while the bid-ask volume imbalance has slumped almost 120%.
Shiba Inu (SHIB) price is trading with a bearish bias as bulls continue to lose ground to the bears. It appears the token burns are not achieving the expected result, given that the meme coin has recorded massive losses since the year started, with more to come as sellers continue to dominate the market. SHIB could soon hit rock bottom before a pullback, although it should not be a surprise if the dog-themed token records another all-time low.
Also Read: New SHIB investors bring deposits to the network but fail to trigger a rise in Shiba Inu price
Shiba Inu price eyes 5% more losses
Shiba Inu (SHIB) price indicates that bears have overpowered bulls for three consecutive months. While many factors have played a role in the previous load-shedding exercises, the latest downtrend is attributed to community conflict after SHIB Token’s official Discord was paused on May 30, citing community conflicts. Reportedly, Shiba Inu’s fast food chain Welly’s Burger sent 37 Ethereum (ETH) to the SHIB Army, but Trophias, a well-known controversial member of the SHIB Defense Breed, intercepted the funds.
The longstanding conflicts continue to hurt Shiba Inu price, delivering SHIB to its three-month low at around $0.00000841. An increase in seller momentum beyond this level could see the meme coin break below the immediate support at $0.00000788 to collect sell-side liquidity below that level.
Notably, the Relative Strength Index supports this thesis given its southward inclination and about to cross below the yellow band (signal line), often interpreted as a sell signal. Traders heeding this call could solidify the downtrend in the meantime.
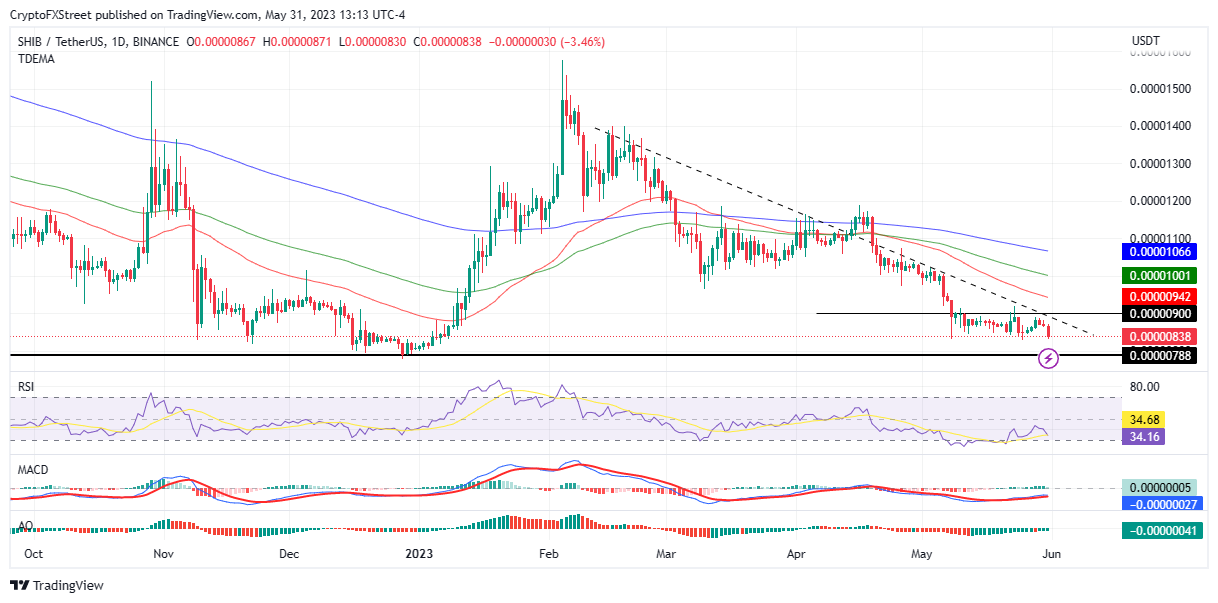
SHIB/USDT 1-Day Chart
On-chain metrics
On-chain metrics from IntoTheBlock also support the bearish postulation. Specifically, the metrics of the large transactions have dropped by almost 80% since the onset of May, dropping from 92 to 19 between May 6 and May 31. At the same time, the bid-ask volume imbalance has fallen by 118%.
On the other hand, the Shiba Inu price could correct with the right buyer momentum, possibly as traders buy the dip, sidelined investors come in, or the typical smart money buying SHIB in loads to manipulate the market.
Such a move could see Shiba Inu price shatter the downtrend line’s resistance at $0.00000900, clearing the path for more gains.
Information on these pages contains forward-looking statements that involve risks and uncertainties. Markets and instruments profiled on this page are for informational purposes only and should not in any way come across as a recommendation to buy or sell in these assets. You should do your own thorough research before making any investment decisions. FXStreet does not in any way guarantee that this information is free from mistakes, errors, or material misstatements. It also does not guarantee that this information is of a timely nature. Investing in Open Markets involves a great deal of risk, including the loss of all or a portion of your investment, as well as emotional distress. All risks, losses and costs associated with investing, including total loss of principal, are your responsibility. The views and opinions expressed in this article are those of the authors and do not necessarily reflect the official policy or position of FXStreet nor its advertisers. The author will not be held responsible for information that is found at the end of links posted on this page.
If not otherwise explicitly mentioned in the body of the article, at the time of writing, the author has no position in any stock mentioned in this article and no business relationship with any company mentioned. The author has not received compensation for writing this article, other than from FXStreet.
FXStreet and the author do not provide personalized recommendations. The author makes no representations as to the accuracy, completeness, or suitability of this information. FXStreet and the author will not be liable for any errors, omissions or any losses, injuries or damages arising from this information and its display or use. Errors and omissions excepted.
The author and FXStreet are not registered investment advisors and nothing in this article is intended to be investment advice.
Recommended Content
Editors’ Picks
Can TRX trigger 30% breakout rally after multiple rejections?

TRON (TRX) price is attempting to overcome a resistance level for the third time this year. Another failure could prove costly for TRX holders, but a breakout could trigger a massive uptrend.
This short-term Bitcoin holder indicator forecasts another rally for BTC

Bitcoin price currently trades at $26,242 with dampened volatility. But things could change quickly, as indicated by these on-chain metrics that track the behavior of BTC holders.
Litecoin price is failing recovery as Whales pull back to December 2020 lows

Litecoin price has been unable to flip the 50-day EMA into a support floor since August began. The LTC whales, which command nearly 12% of the entire circulating supply, currently have been subdued.
Members of US FSC urge SEC Chair Gensler to immediately approve spot Bitcoin ETFs

United States House Financial Services Committee members sent out a letter to Gary Gensler addressing the spot Bitcoin ETFs. The letter called the SEC’s standards of denial of spot ETFs “inconsistent and discriminatory”.
Bitcoin: BTC downside likely after 20-week EMA culls bulls

Bitcoin (BTC) bearish price fractal, as discussed in a previous article, is underway, but the lack of volatility is causing ambiguity and doubt. Regardless, BTC might see a bit of an upside before the long-term bearish scenario plays out.