Shiba Inu price distils bullish signals out of Russia-Ukraine talks, eyes return to $0.000024


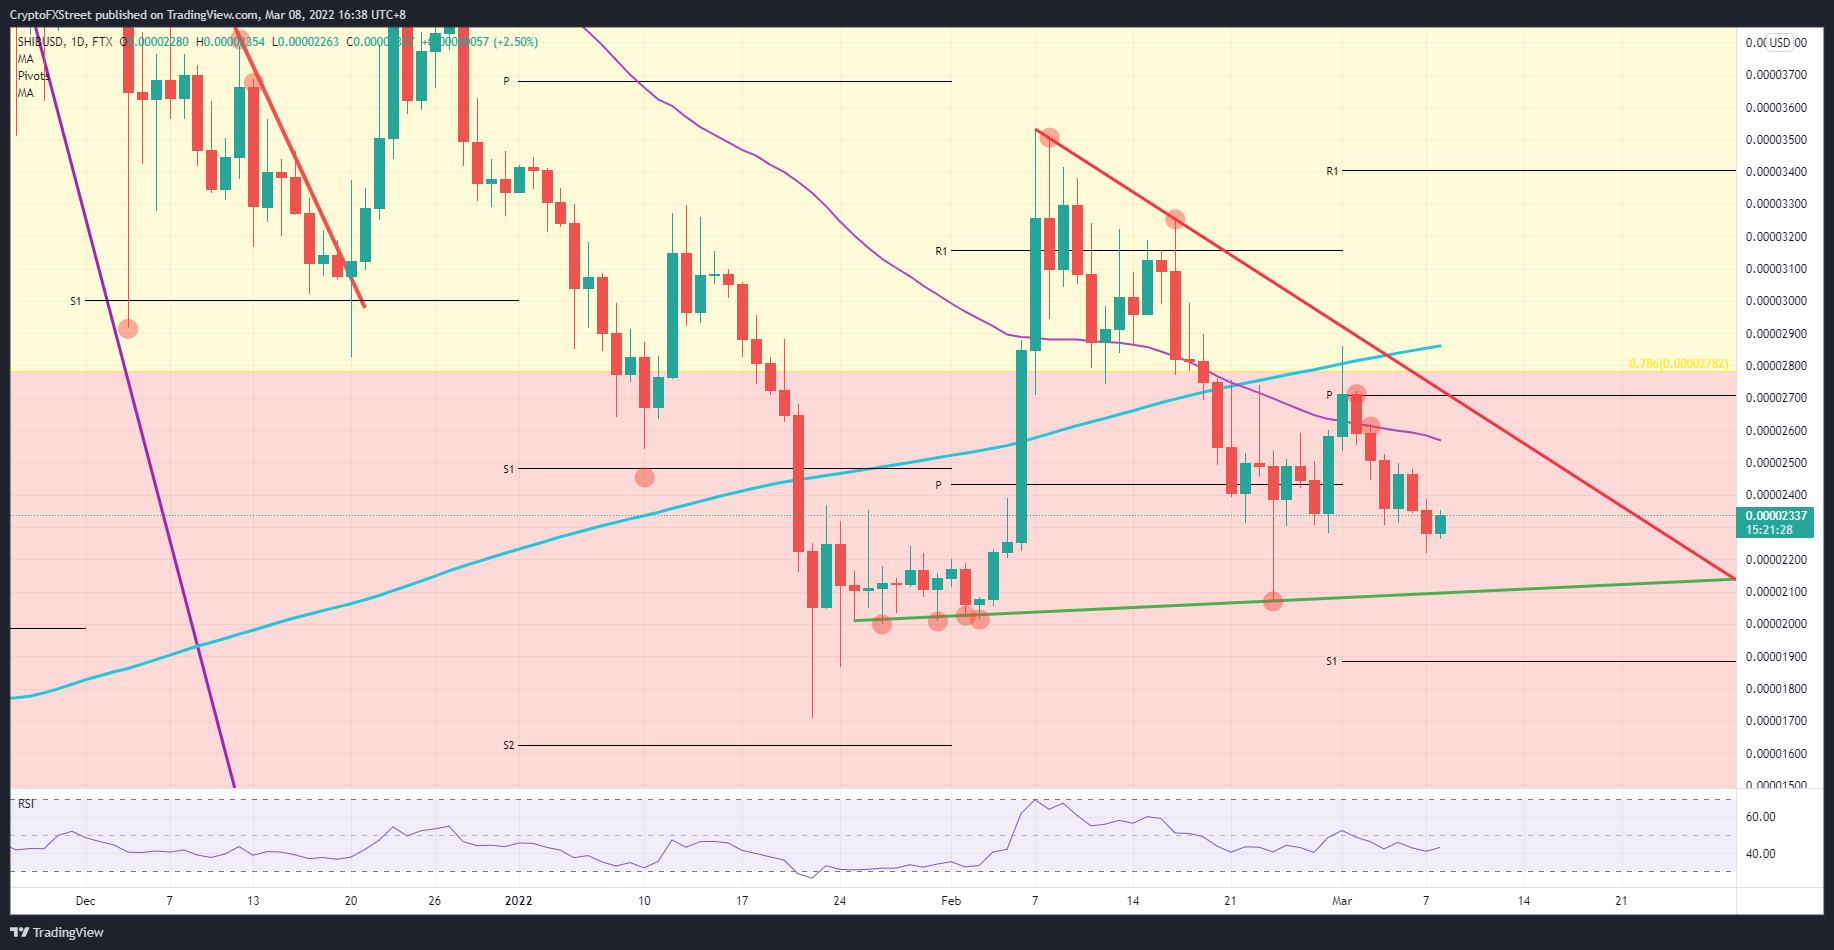
  • Shiba Inu price action is still trading in the broader term triangle with support at $0.00002100 and $0.00002700 to the topside.
  • SHIB price performs knee-jerk recovery as positive peace talks between Russia and Ukraine set a tone of hope and relief.
  • Expect to see short-term returns to $0.00002400, with an upside target at $0.00002600, holding 11% gains.

Shiba Inu (SHIB) price action was on the back foot these past few days with some firm rejections last week at the monthly pivot and the 55-day Simple Moving Average (SMA) – providing bears with two entry points . Add to that equation a stronger dollar as a safe-haven, and SHIB price was under double pressure from two bearish forces. With the announcement of the third round of peace talks, markets are optimistic and triggering a relief rally that could tick $0.00002400 intraday, and could even go all the way to $0.00002700 should further relief signals emerge from global markets.

Shiba Inu price looks ready to jump

Shiba Inu price action is rallying into the European session after announcing that Ukraine and Russia are entering the third round of peace talks, and human corridors will be installed throughout Tuesday. Bulls use these headlines for diving into the price action and using the low of February 28 at $0.00002280 as an entry point. The bull army is being reflected in the Relative Strength Index’s knee-jerk reaction higher as the RSI shifts back up towards 50 but is still ultimately subdued at the moment.

SHIB price looks set to take out yesterday's high and try to tick $0.00002400. Key will be to see where the daily close ends up and how sticky positive headlines prove to be. Going into the U.S. session and tomorrow’s ASIA PAC price needs to stay above $0.00002400 to relay to traders that the rally is viable. Expect to see more inflows tomorrow with SHIB set to tick either $0.00002600 at the 55-day SMA or around the monthly pivot at $0.00002700.

SHIB/USD daily chart

SHIB/USD daily chart

This rally hangs on the lips of any new headlines coming out and hitting the wires. A negative headline could easily trip it up and see bulls falling flat on their belly against the opening price at $0.00002280. Other negative headlines could quickly accelerate the drop towards the green baseline of the triangle, taking out $0.00002200 to the downside and looking for support at $0.00002100. Although negative, the loss would be pretty contained, amounting to an 8% or 9% loss against today's opening price.


Information on these pages contains forward-looking statements that involve risks and uncertainties. Markets and instruments profiled on this page are for informational purposes only and should not in any way come across as a recommendation to buy or sell in these assets. You should do your own thorough research before making any investment decisions. FXStreet does not in any way guarantee that this information is free from mistakes, errors, or material misstatements. It also does not guarantee that this information is of a timely nature. Investing in Open Markets involves a great deal of risk, including the loss of all or a portion of your investment, as well as emotional distress. All risks, losses and costs associated with investing, including total loss of principal, are your responsibility. The views and opinions expressed in this article are those of the authors and do not necessarily reflect the official policy or position of FXStreet nor its advertisers. The author will not be held responsible for information that is found at the end of links posted on this page.

If not otherwise explicitly mentioned in the body of the article, at the time of writing, the author has no position in any stock mentioned in this article and no business relationship with any company mentioned. The author has not received compensation for writing this article, other than from FXStreet.

FXStreet and the author do not provide personalized recommendations. The author makes no representations as to the accuracy, completeness, or suitability of this information. FXStreet and the author will not be liable for any errors, omissions or any losses, injuries or damages arising from this information and its display or use. Errors and omissions excepted.

The author and FXStreet are not registered investment advisors and nothing in this article is intended to be investment advice.

Join Telegram

Recommended content


Recommended Content

Editors’ Picks

Why crypto may see a recovery right before or shortly after Bitcoin halving

Why crypto may see a recovery right before or shortly after Bitcoin halving

Cryptocurrency market is bleeding, with Bitcoin price leading altcoins south in a broader market crash. The elevated risk levels have bulls sitting on their hands, but analysts from Santiment say this bleed may only be cauterized right before or shortly after the halving.

More Cryptocurrencies News

Manta Network price braces for volatility as $44 million worth of MANTA is due to flood markets

Manta Network price braces for volatility as $44 million worth of MANTA is due to flood markets

Manta Network (MANTA) price was not spared from the broader market crash instigated by a weakness in the Bitcoin (BTC) market. While analysts call a bottoming out in the BTC price, the Web3 modular ecosystem token could suffer further impact.

More Manta Network News

Bitcoin price uptrend to continue post-halving, Bernstein report says as traders remain in disarray

Bitcoin price uptrend to continue post-halving, Bernstein report says as traders remain in disarray

Bitcoin is dropping amid elevated risk levels in the market. It comes as traders count hours to the much-anticipated halving event. Amid the market lull, experts say we may not see a rally until after the halving. 

More Bitcoin News

OMNI post nearly 50% loss after airdrop and exchange listing

OMNI post nearly 50% loss after airdrop and exchange listing

Omni network (OMNI) lost nearly 50% of its value on Wednesday after investors dumped the token following its listing on top crypto exchanges. A potential reason for the crash may be due to the wider crypto market slump.

More Omni Network News

Bitcoin: BTC’s rangebound movement leaves traders confused

Bitcoin: BTC’s rangebound movement leaves traders confused

Bitcoin (BTC) price has been hovering around the $70,000 psychological level for a few weeks, resulting in a rangebound movement. This development could lead to a massive liquidation on either side before a directional move is established. 

Read full analysis

BTC

ETH

XRP