Shiba Inu price consolidates before SHIBA enters a new bull market
- Shiba Inu stuck inside a tight congestion zone for the past eight days.
- Consolidation precedes new trends and corrections.
- Bullish breakout on the Point and Figure chart supports the weekly Ichimoku chart analysis.
Shiba Inu price may soon see an end to the consolidation and lower swing lows it has experienced since October 2021. Last week’s candlestick was a bullish hammer, giving many traders the signal needed to convert to the long side of the market.
Shiba Inu prints bullish weekly candlestick pattern, SHIBA primed for a big rally
Shiba Inu price, believe it or not, remains in a bull market within the weekly Relative Strength Index. It is currently between the two oversold levels in a bull market, 40 and 50. Additionally, the Composite Index has been at historic lows since the beginning of 2022. The combination of the bullish hammer candlestick pattern and the extreme oversold levels on the Composite Index indicates an impending bullish reversal.
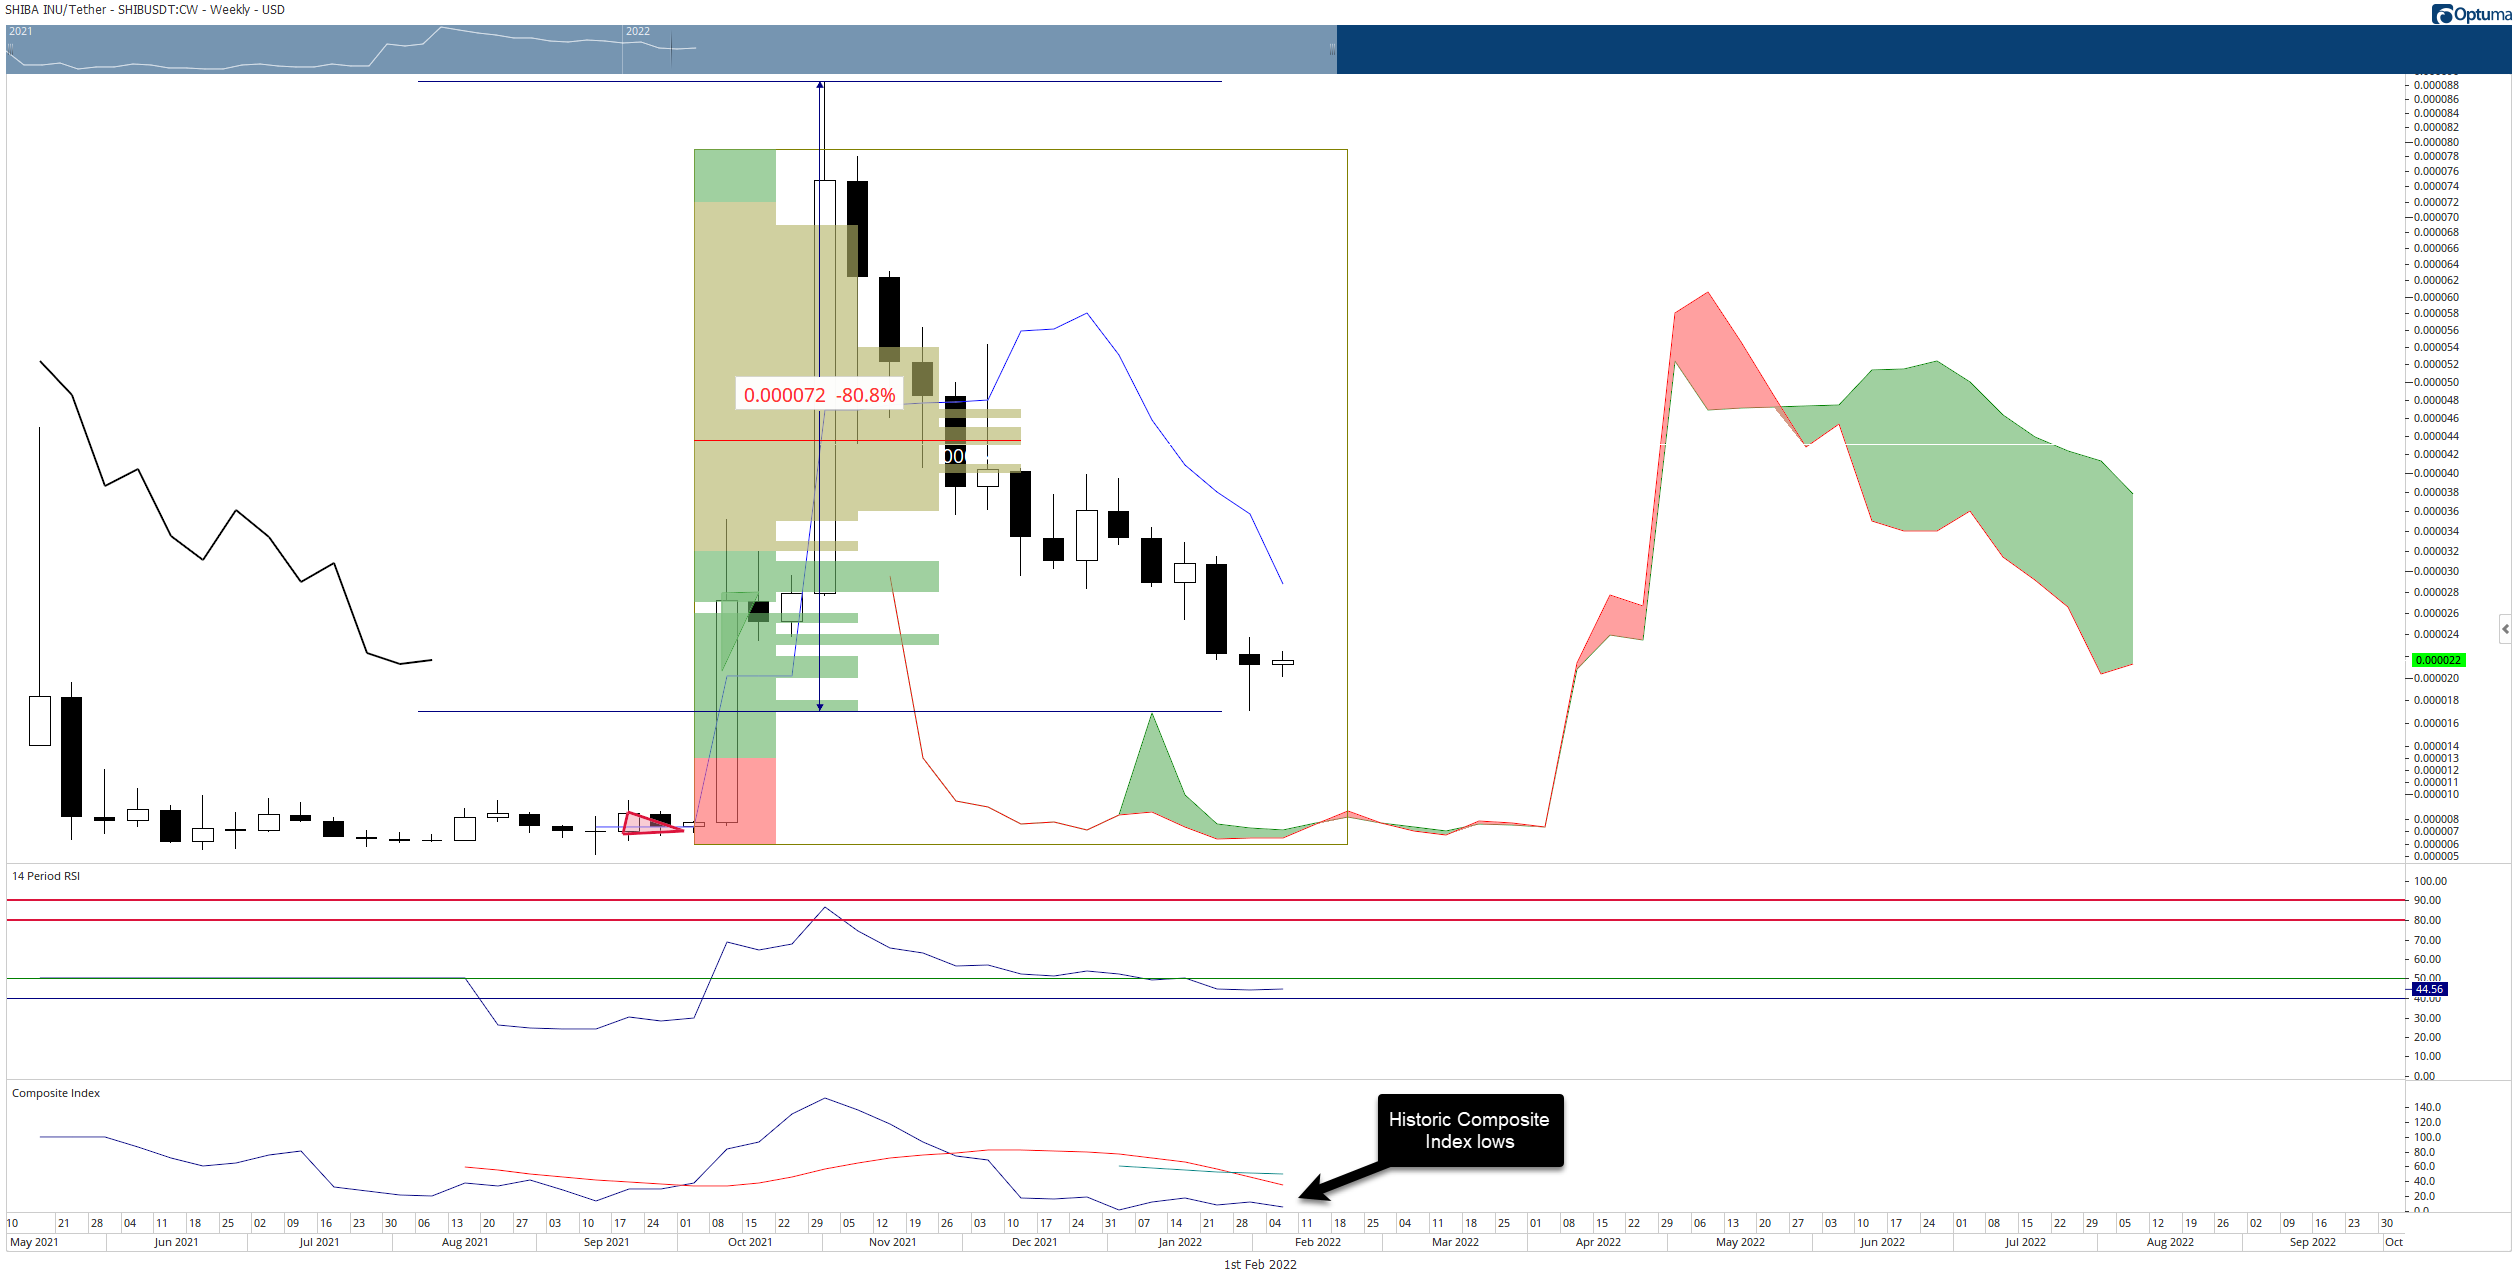
SHIBA/USDT Weekly Ichimoku Kinkoo Hyo Chart
The theoretical long trade setup is a buy stop at $0.000022, a stop loss at $0.000016, and a profit target at $0.000054. The trade represents a 5.33:1 reward/risk with an implied profit target of 145% from the entry. However, the chances that Shiba Inu price will move from the entry to the profit target in a single column is unlikely. Therefore, a three-box trailing stop would help protect any profit earned post entry.
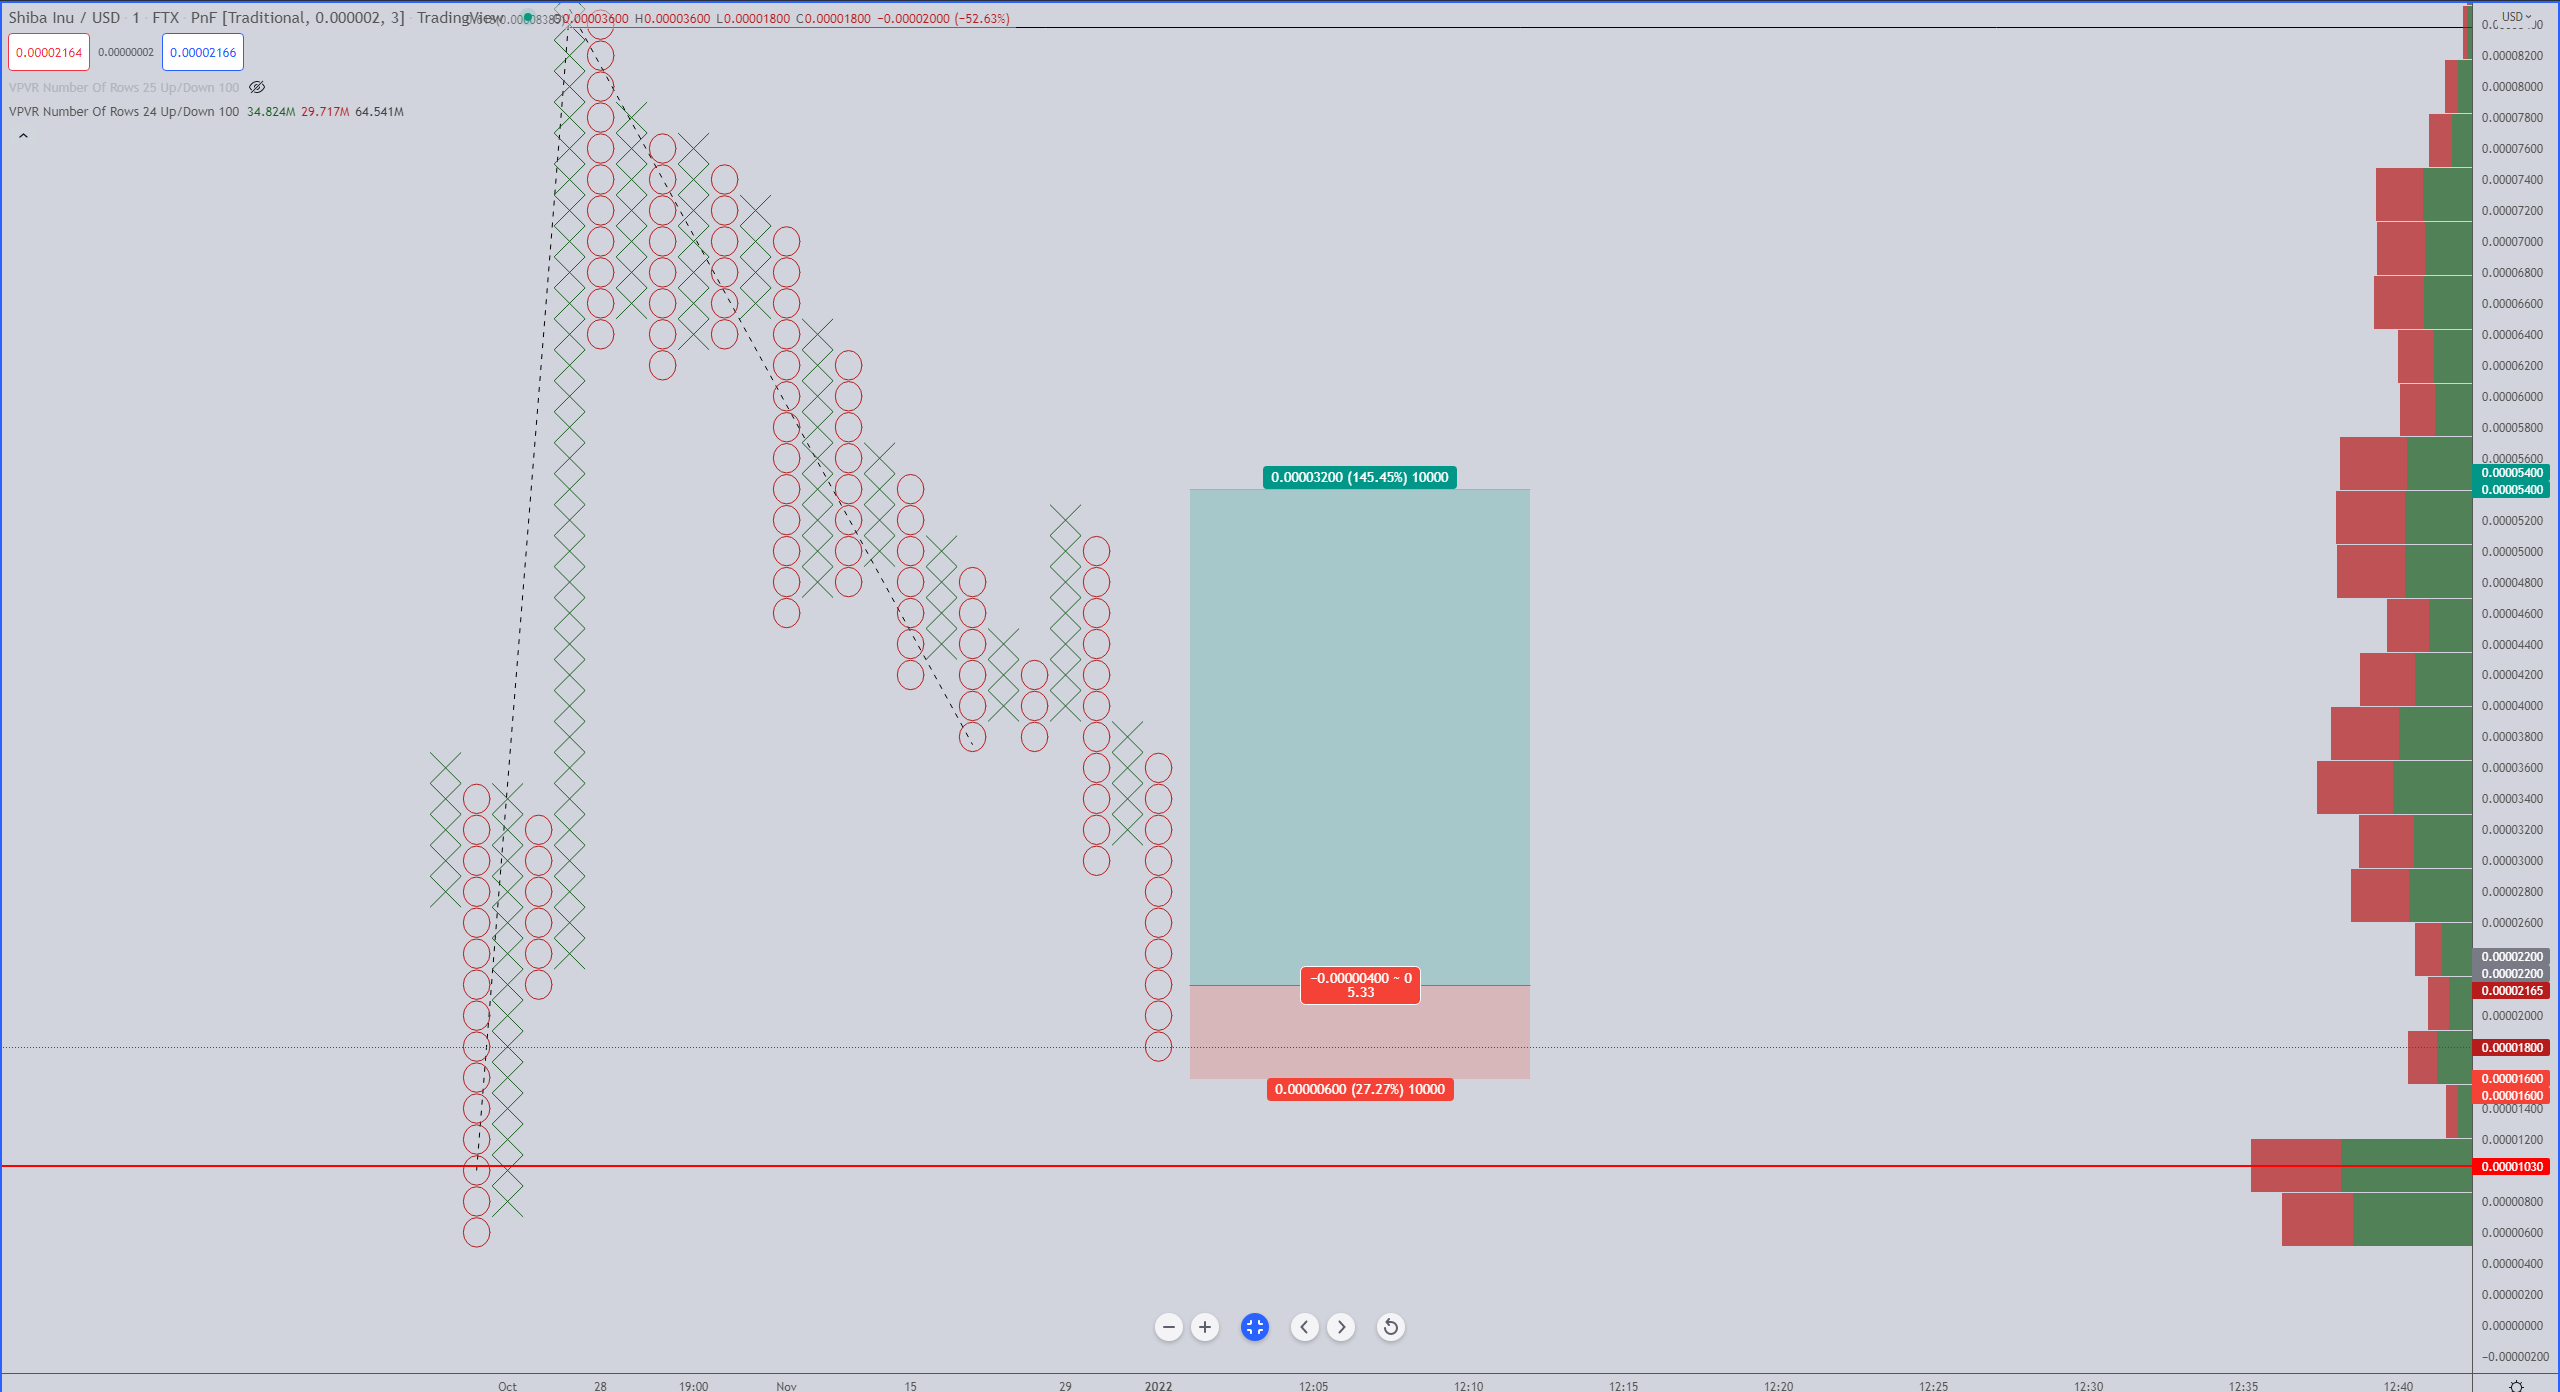
SHIBA/USD $0.000002/3-box Reversal Point and Figure Chart
If the current O-column continues to move lower, the entry moves in tandem with the lower price movement. As a result, the three-box stop loss or 3-box trailing stop from the entry moves as well. The profit target, however, remains the same. Because of this Point and Figure pattern, there is no invalidation point for a Shiba Inu price long entry.
Author

Jonathan Morgan
Independent Analyst
Jonathan has been working as an Independent future, forex, and cryptocurrency trader and analyst for 8 years. He also has been writing for the past 5 years.


