Shiba Inu price struggles to hold support, could drop by 20%
- Shiba Inu price has held to a support zone in the $0.000020 value area.
- Extremely tight trading range since Tuesday.
- A 20% drop is coming up if SHIBA fails to hold $0.000020.

Shiba Inu price has traded in an extremely constricted and thinly traded price range for the last four trading days. The consolidation is evidence of an upcoming breakout – but the direction remains unknown.
Shiba Inu price stubbornly maintains support as bulls and bears retreat from SHIBA
Shiba Inu price faces the twelfth consecutive day of a daily candlestick close below the Tenkan-Sen. While the Volume Profile has developed a high volume node, SHIBA could quickly push lower and towards a much lower low, suggesting a solid future support zone.
From an Ichimoku Kinko Hyo perspective, Shiba Inu has zero upcoming support on the daily chart. Shiba Inu price is below the Cloud (Senkou Span A and Senkou Span B), the Tenkan-Sen, and the Kijun-Sen. Future Senkou Span A is below Future Senkou Span B, and the Chikou Span is below the candlesticks in open space. In other words, within the Ichimoku system on the daily chart, SHIBA is in price discovery mode and has a free hand to keep moving lower.
The nearest Ichimoku support level for Shiba Inu is on the weekly Ichimoku chart. Senkou Span A at $0.000007 is the closest Ichimoku support level for Shiba Inu price. However, a massive bounce could occur at any moment. The oscillators support a bullish breakout if one occurs.
The daily Composite Index has bounced off of all-time lows and looks prepared to cross above both of its averages. At the same time, the Relative Strength Index is right on top of the first oversold level in a bear market at 30.
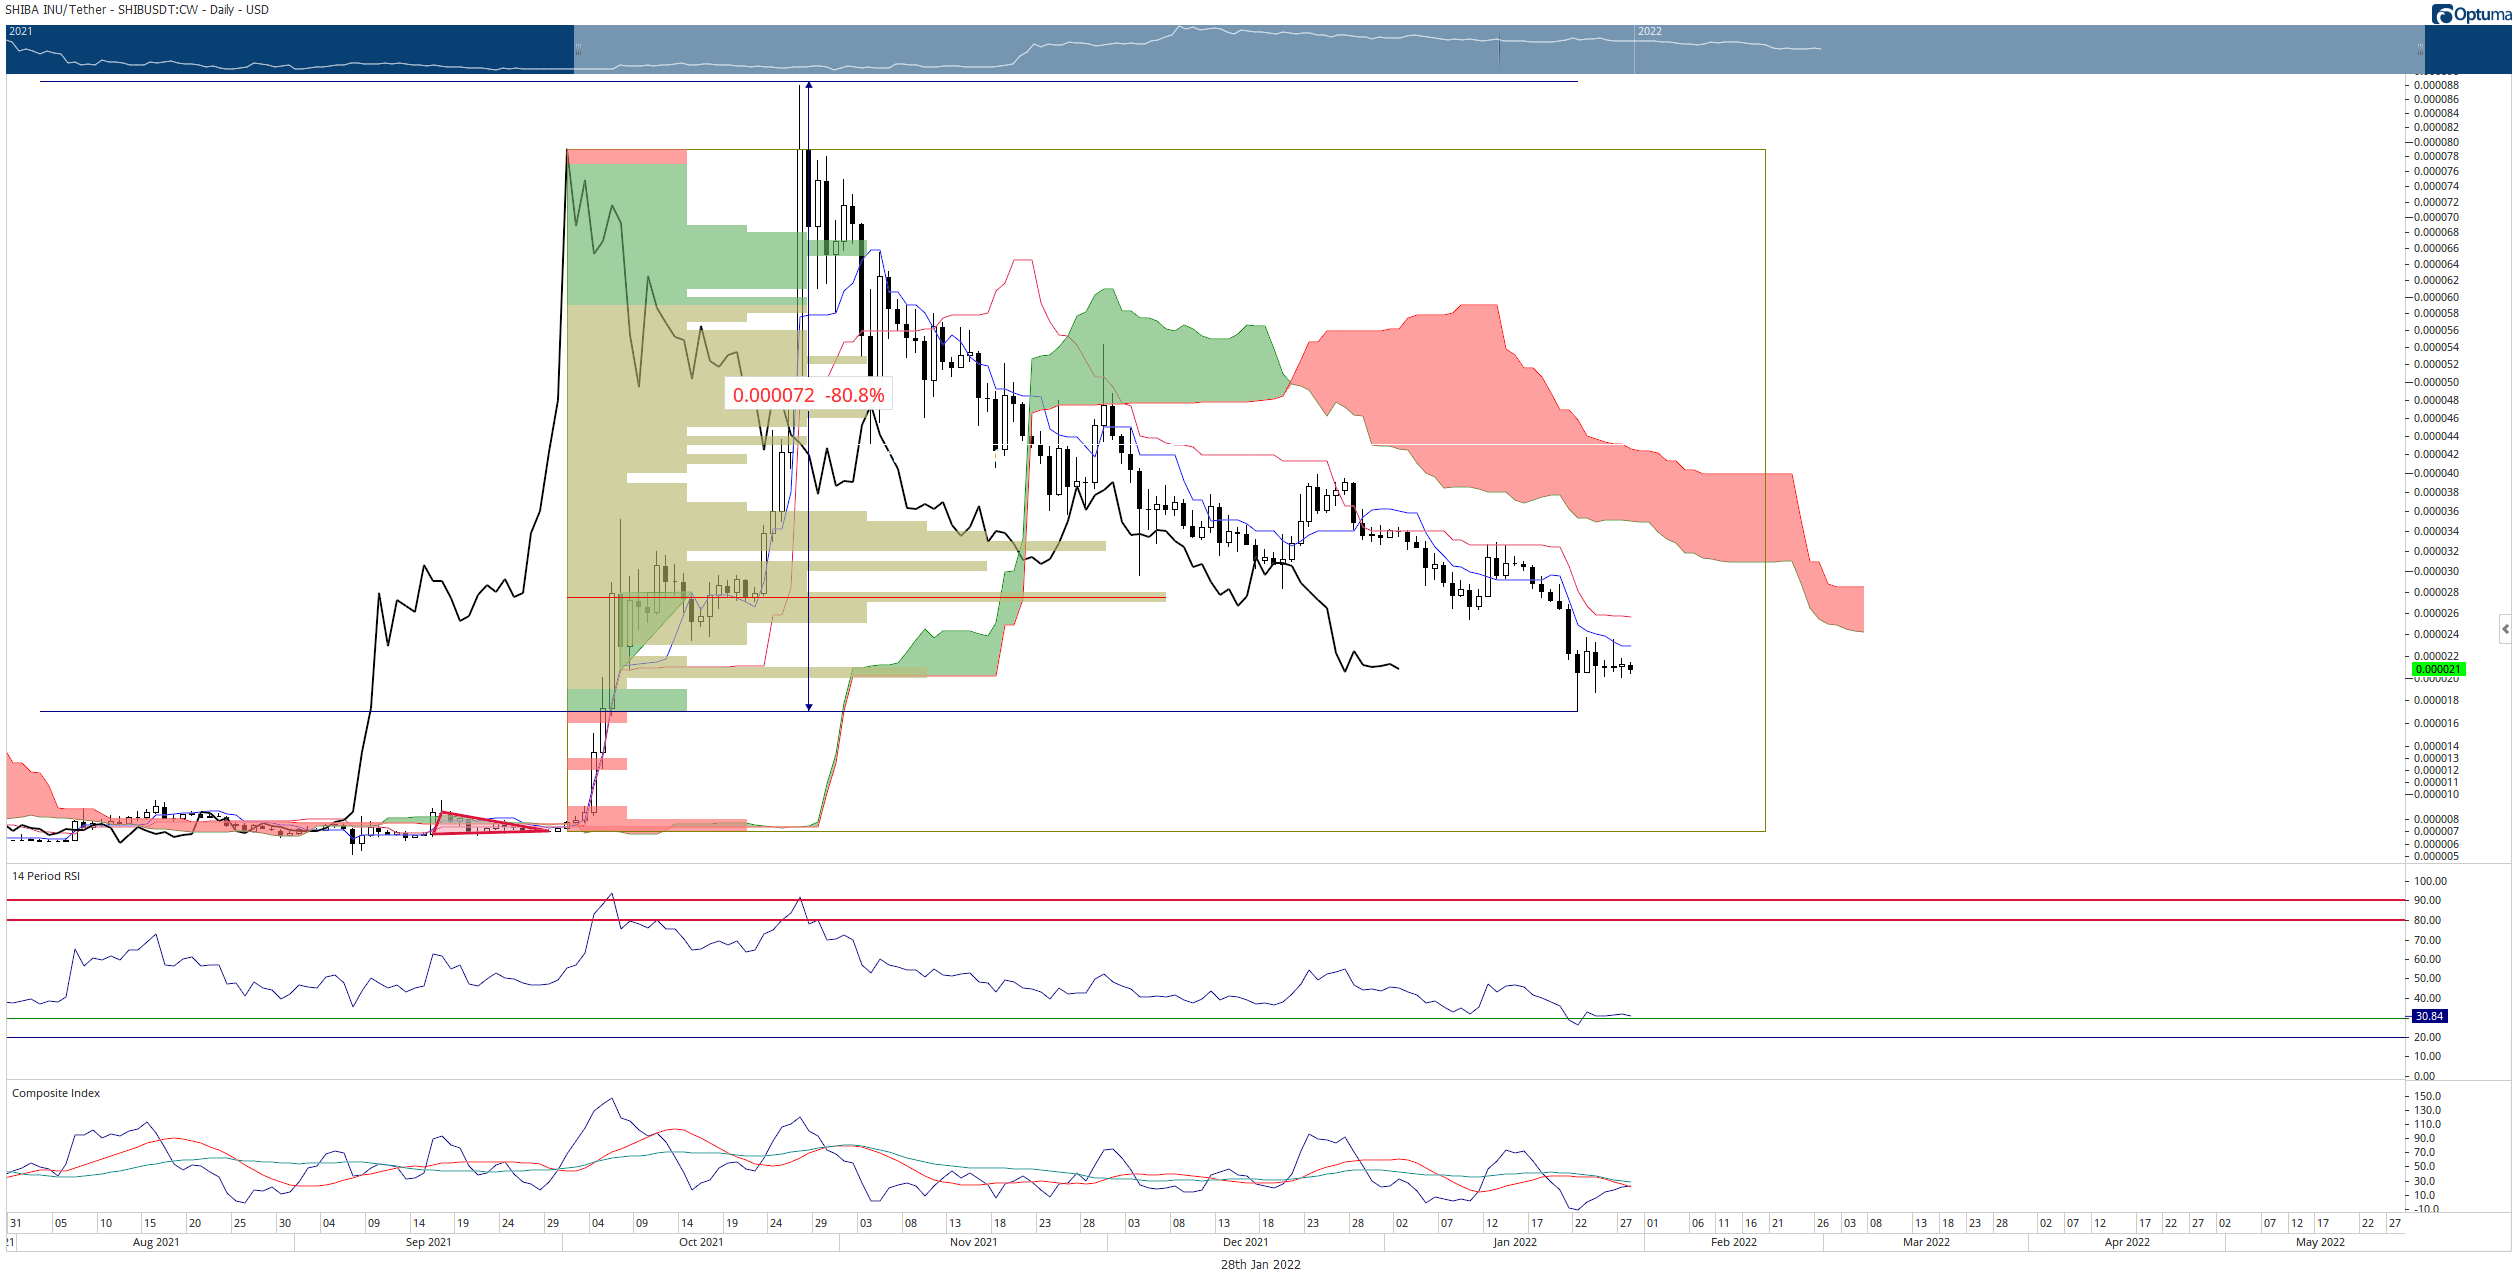
SHIBA/USDT Daily Ichimoku Kinko Hyo Chart
To generate any hint of termination of this current downtrend, Shiba Inu price will need a daily close above the Tenkan-Sen, Kijun-Sen, and the Volume Point Of Control. A close at or above $0.000027 would put Shiba Inu above the Tenkan-Sen, and Kijun-Sen but right on top of the Volume Point of Control. In that scenario, SHIBA would have the base of support to lift SHIBA to test $0.000034.
Author

Jonathan Morgan
Independent Analyst
Jonathan has been working as an Independent future, forex, and cryptocurrency trader and analyst for 8 years. He also has been writing for the past 5 years.



