Shiba Inu price eyes 40% upswing as SHIB downtrend faces exhaustion
- Shiba Inu price has produced five lower highs over the past 20 days, suggesting a bearish regime.
- A breakout from this downtrend will see SHIB tag $0.0000565 and $0.0000625 barriers.
- A breakdown of the $0.0000360 support floor will invalidate the bullish thesis.
Shiba Inu price action is getting congested with each lower high, suggesting consolidation. If this development continues, SHIB will likely break out from the downtrend and result in an explosive upswing.
Shiba Inu price gathers steam
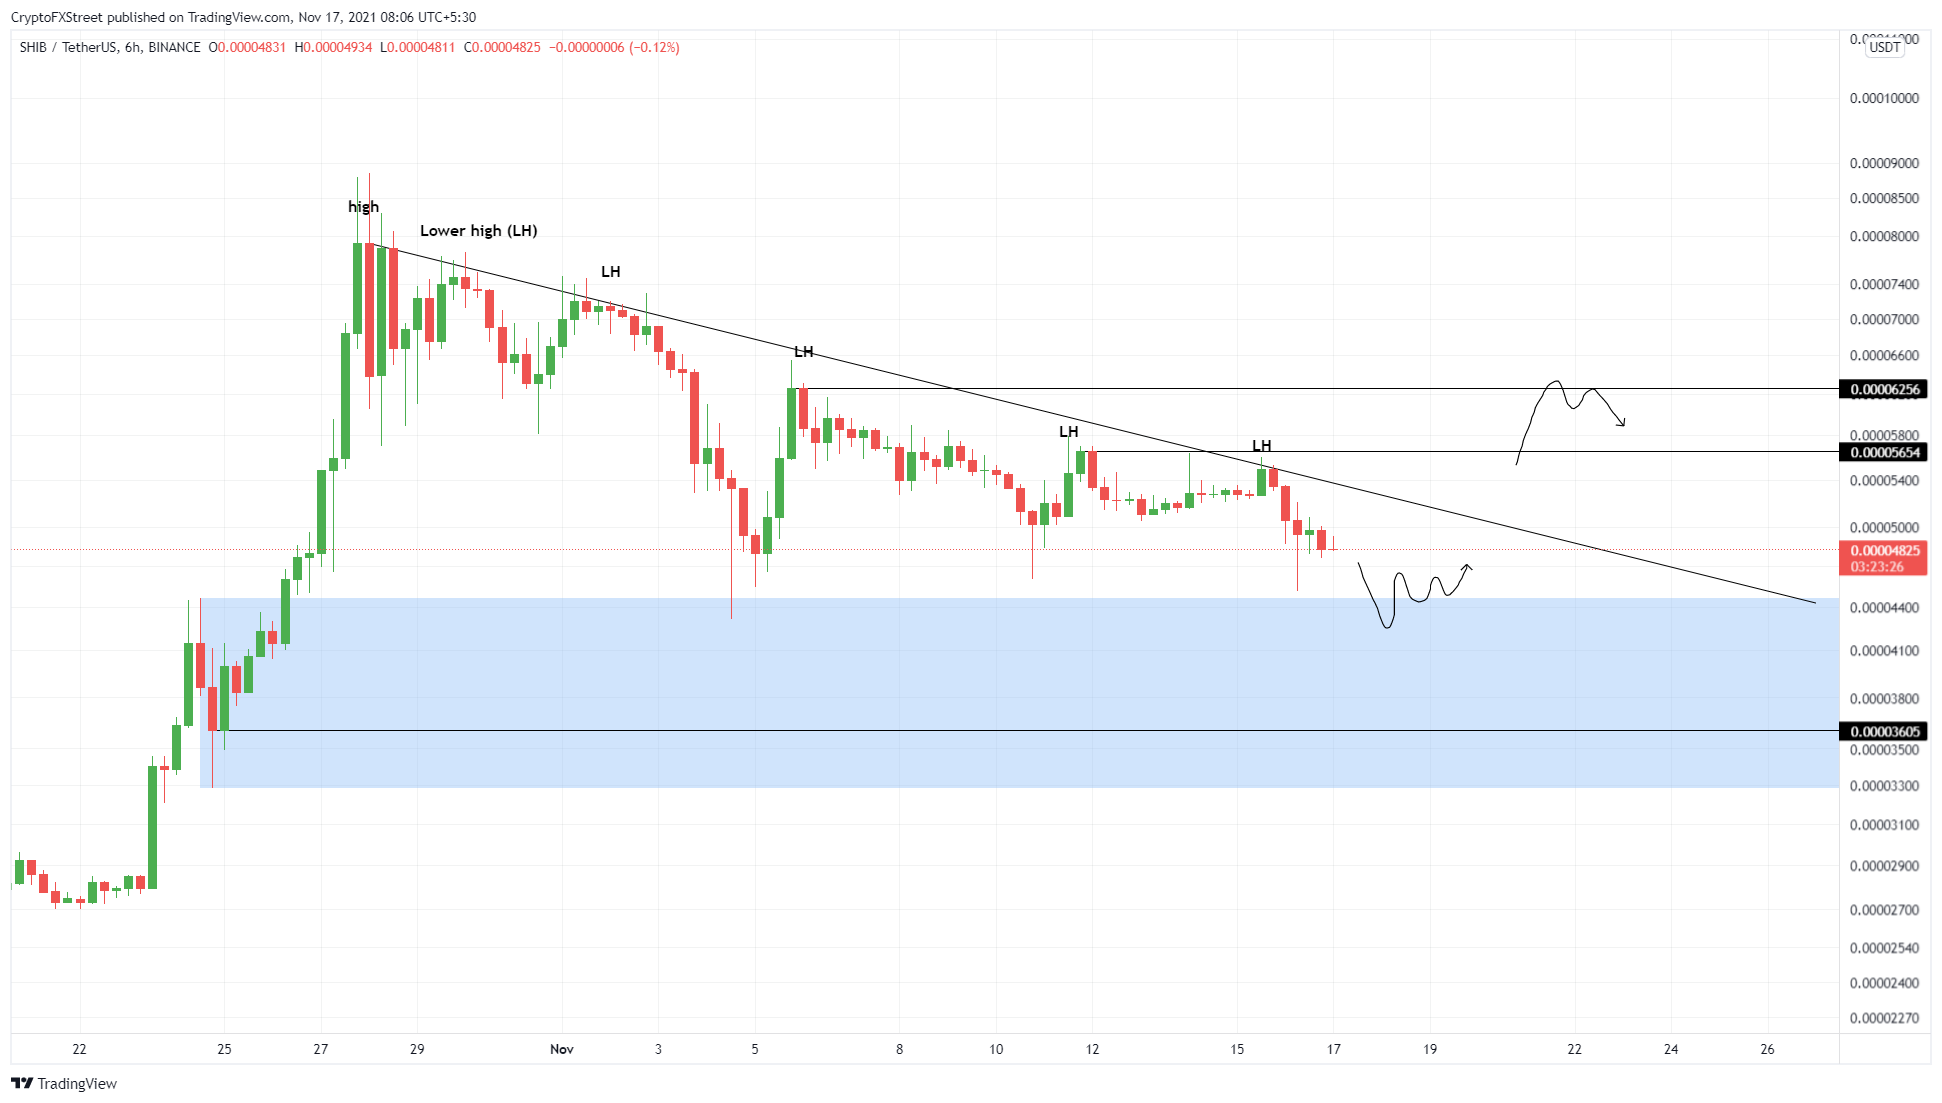
Shiba Inu price set up its all-time high at $0.0000885 on October 28, and since this point, it has created five lower highs, suggesting a full-fledged downtrend. A trend line connecting these swing points can be drawn, indicating a sloping resistance barrier.
The demand zone, extending from $0.0000328 to $0.0000446, will support the incoming selling pressure and provide Shiba Inu price with a base it needs. Market participants can expect buyers to accumulate SHIB at a discount and trigger an upswing.
A confirmation of this trend change will arrive after SHIB rallies at least 26% and shatters the declining trend line to produce a higher high above $0.0000565. Beyond this, Shiba Inu price will make a run for the crucial barrier at $0.0000625, constituting a 40% ascent from the said demand zone.
SHIB/USDT 1-day chart
While things are looking grim for Shiba Inu price, a breakdown of the $0.0000360 support floor will suggest that the buyers are not in control and that a deeper correction is likely. This move will also invalidate the bullish thesis and trigger a potential 20% crash to $0.00000285.
Author

Akash Girimath
FXStreet
Akash Girimath is a Mechanical Engineer interested in the chaos of the financial markets. Trying to make sense of this convoluted yet fascinating space, he switched his engineering job to become a crypto reporter and analyst.


