Shiba Inu needs to clear remaining hurdles before SHIB bulls kick-start next major bull run
- Shiba Inu price is enduring a tough recovery as it confronts several major resistance areas ahead.
- If SHIB manages to slice above these crucial resistance barriers, the token could see an explosive rally.
- The prevailing chart pattern suggests that the canine-themed token is ready for a bounce toward $0.00011465.
Shiba Inu price appears to be losing momentum as SHIB consolidates following its tremendous rally in late October. However, the meme-based token could be gearing up for a major rally toward $0.00011465 if it manages to slice above a few critical obstacles in its way.
Shiba Inu price prepares for 66% ascent
Shiba Inu price has formed a bullish continuation pattern on the 4-hour chart, suggesting that once SHIB is able to slice above the overpowering resistances ahead, a substantial rally is on the radar.
Shiba Inu price has printed a bull flag pattern, with a bullish target of a 66% climb toward $0.00011140. SHIB recently retested the lower boundary of the governing technical pattern, forming a lower low following the massive surge that formed the pattern’s flagpole.
In order for Shiba Inu price to witness its optimistic target being reached, the first obstacle that SHIB would need to slice above is at the middle boundary of the prevailing chart pattern at $0.00006020. The following resistance for the canine-themed token is at the 61.8% Fibonacci retracement level at $0.00006352.
Stiffer hurdles may emerge at $0.00006782, where the 21 and 50 four-hour Simple Moving Averages (SMA) intersect. Additional roadblocks may appear at the upper boundary of the bull flag at $0.00006933, then at the 78.6% Fibonacci retracement level at $0.00007448, coinciding with the resistance line given by the Momentum Reversal Indicator (MRI).
The Arms Index (TRIN), which gauges overall market sentiment suggests that there are slightly more buyers than sellers in the market, which adds credence to Shiba Inu price recovery.
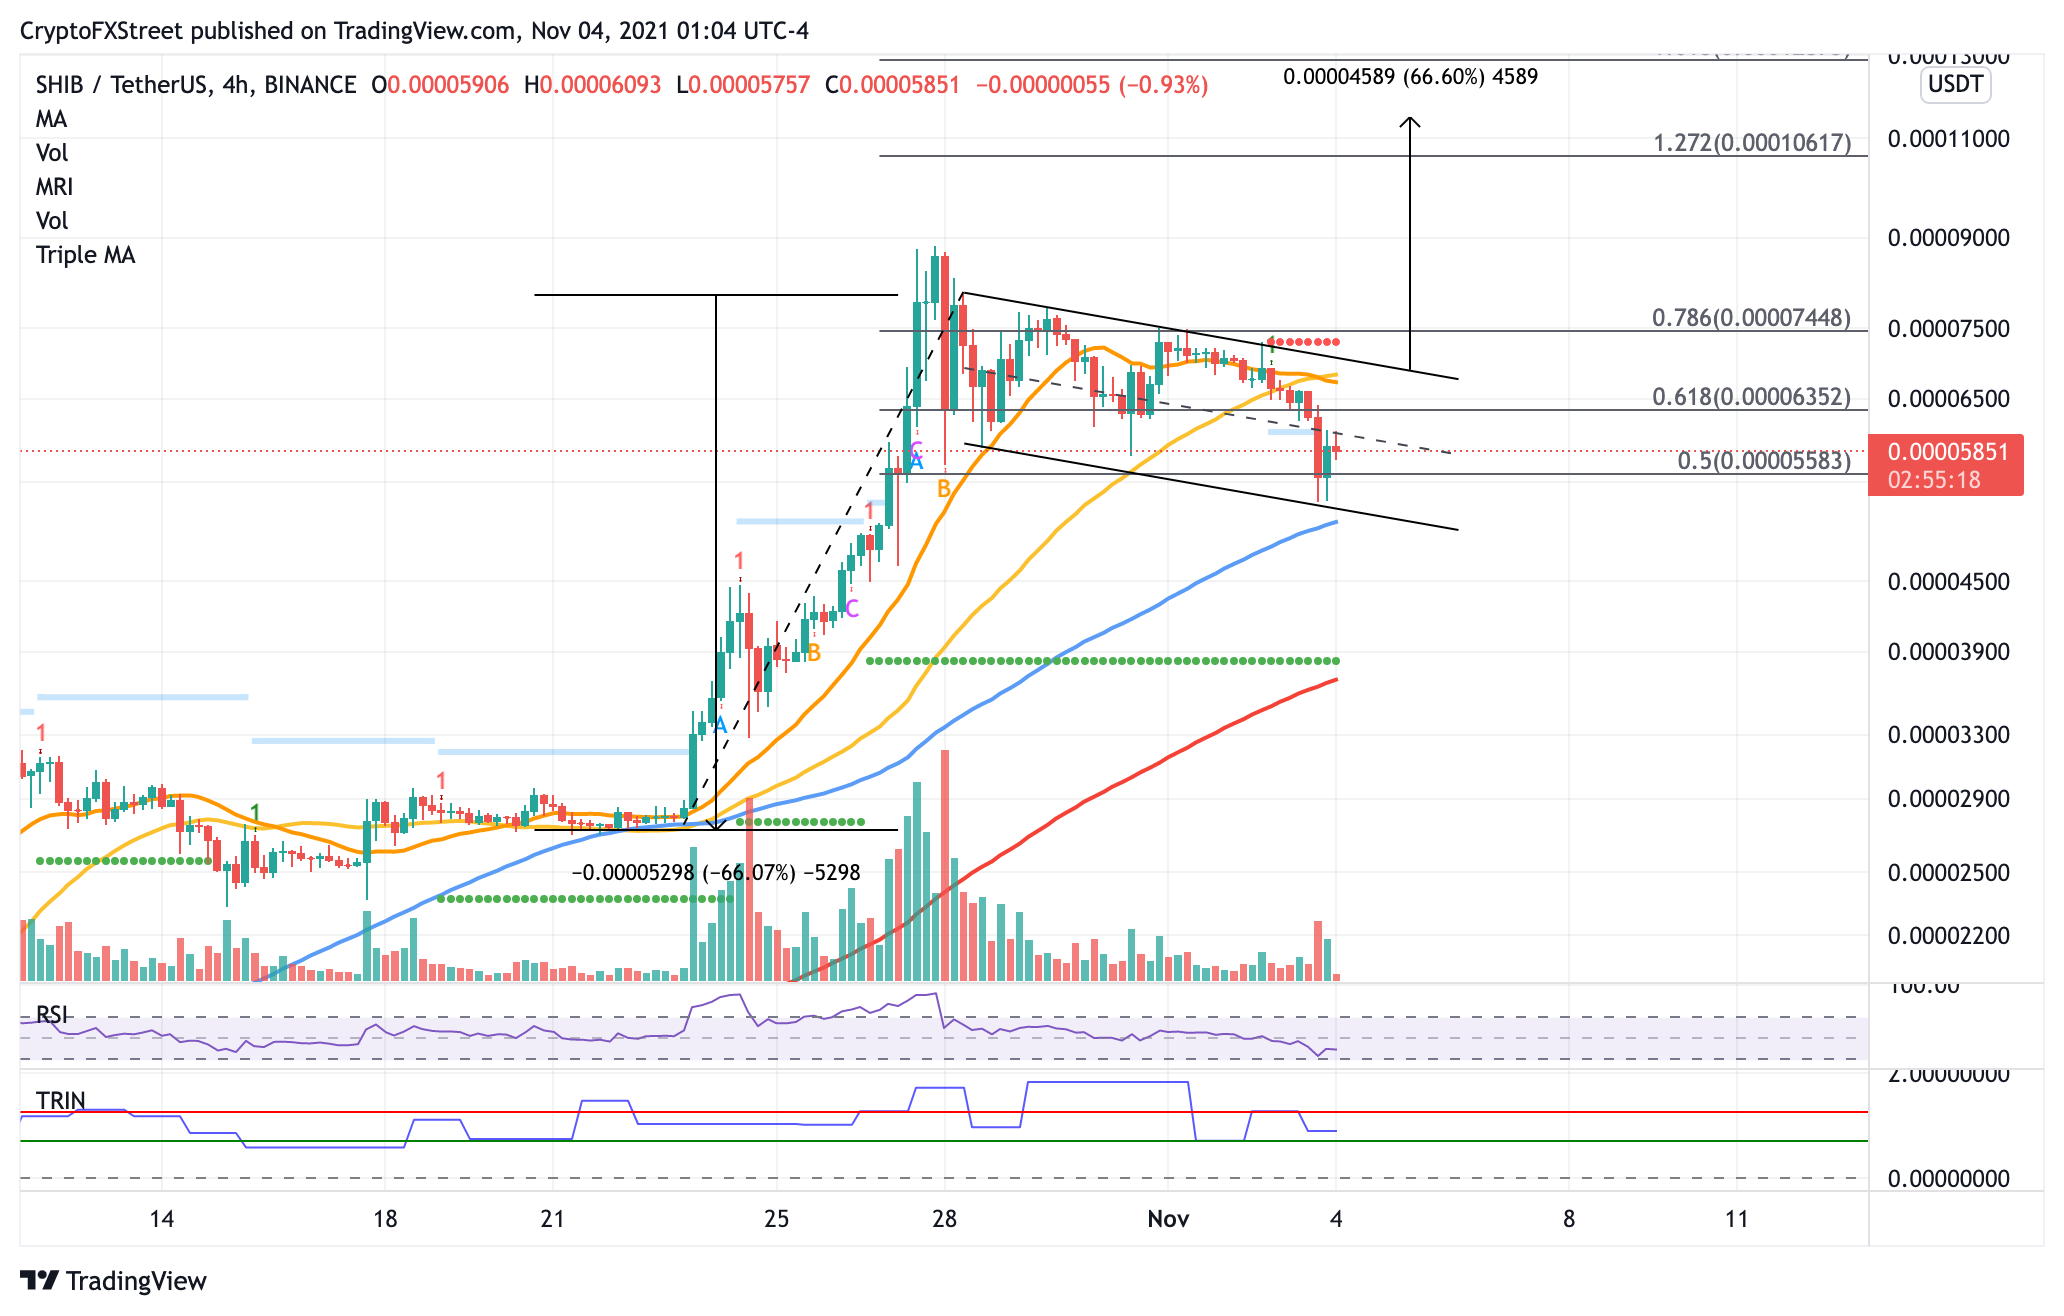
SHIB/USDT 4-hour chart
However, if the obstacles become too tough to crack for SHIB bulls, Shiba Inu may drop toward the 50% Fibonacci retracement level at $0.00005583 as its first line of defense when selling pressure rises.
Additional selling activity may see Shiba Inu price retest the lower boundary of the chart pattern at $0.00005151, before slicing below to tag the 100 four-hour SMA at $0.00005048. In this case, the bullish pattern is voided and SHIB could see further losses.
Author

Sarah Tran
Independent Analyst
Sarah has closely followed the growth of blockchain technology and its adoption since 2016.


