- Shiba Inu price has seen an explosive 34% advance over the last 48 hours.
- A minor retracement should give buyers a chance to recuperate, triggering another 25% upswing.
- A breakdown of the range low at $0.0000282 will invalidate the bullish thesis.
Shiba Inu price experienced a bullish onslaught over the last two days, resulting in an exponential upswing. The run-up, while impressive, failed to collect liquidity resting above a crucial level. Therefore, investors can expect SHIB to retrace briefly before seeing another leg-up.
Shiba Inu price looks ready for more gains
Shiba Inu price rallied roughly 34% in under two days, setting up a swing high at $0.0000378. The uptrend was a result of a liquidity run and a bounce off a significant support level. The run-up was supposed to collect the buy-stops resting above $0.000080, but the bulls fell short.
Investors can expect Shiba Inu price to see a pull-back to the 50% retracement level at $0.0000330 or the 70.5% retracement level at $310. Either way, a bounce off these levels will allow sidelined investors to jump on the bandwagon, triggering another run-up.
From the 62% retracement level at $0.0000318, Shiba Inu price can rally 19% before it approaches the $0.0000380 hurdle to collect the liquidity resting above it. Continued growth in bullish momentum will see SHIB continue this ascent to $0.0000412, suggesting a 25% rally.
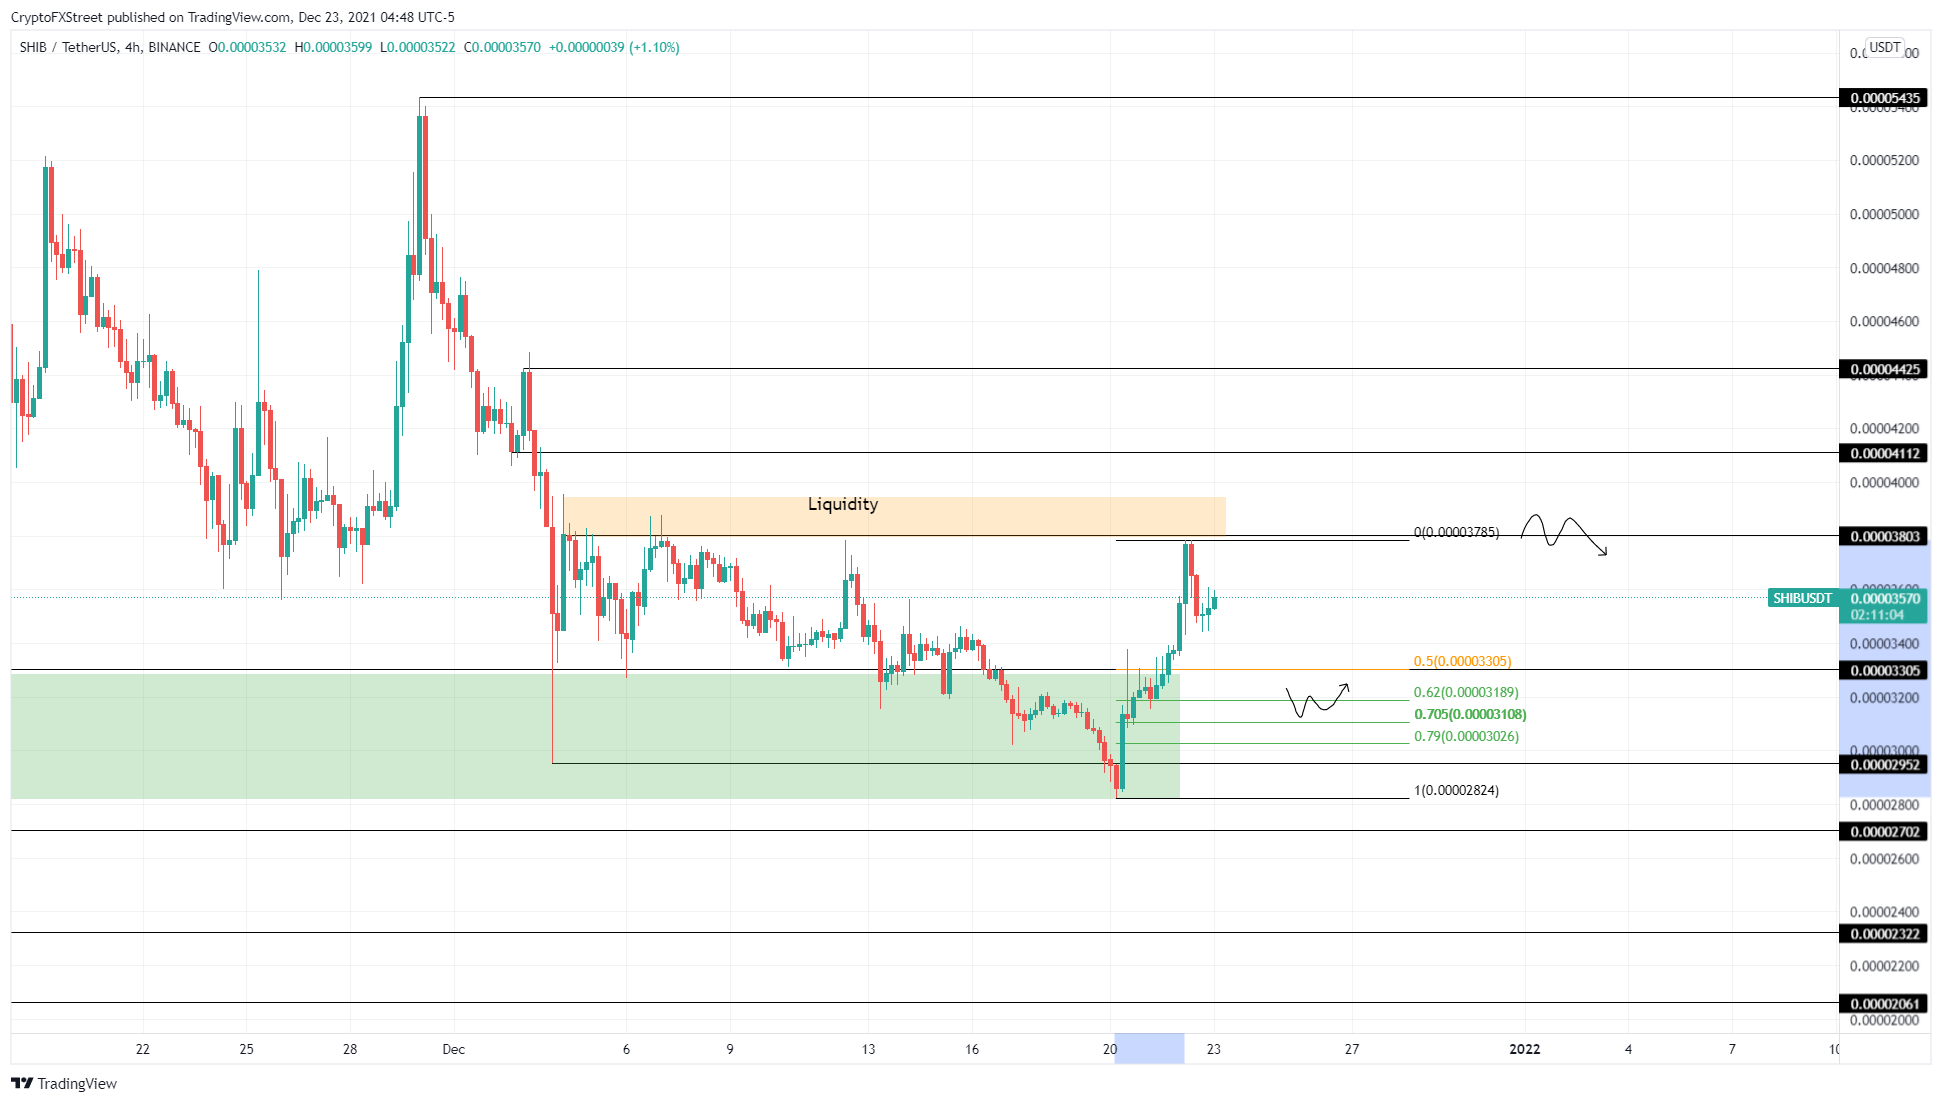
SHIB/USDT 4-hour chart
All in all, Shiba Inu price looks primed for another rally. However, if SHIB fails to hold above the 79% retracement level at $0.0000302, it will indicate weakness among buyers. If this selling pressure continues, pushing SHIB to produce a 4-hour candlestick close below $0.0000282, it will create a lower low, invalidating the bullish thesis.
In this scenario, Shiba Inu price could crash 4% to revisit the $0.0000270 support floor.
Information on these pages contains forward-looking statements that involve risks and uncertainties. Markets and instruments profiled on this page are for informational purposes only and should not in any way come across as a recommendation to buy or sell in these assets. You should do your own thorough research before making any investment decisions. FXStreet does not in any way guarantee that this information is free from mistakes, errors, or material misstatements. It also does not guarantee that this information is of a timely nature. Investing in Open Markets involves a great deal of risk, including the loss of all or a portion of your investment, as well as emotional distress. All risks, losses and costs associated with investing, including total loss of principal, are your responsibility. The views and opinions expressed in this article are those of the authors and do not necessarily reflect the official policy or position of FXStreet nor its advertisers. The author will not be held responsible for information that is found at the end of links posted on this page.
If not otherwise explicitly mentioned in the body of the article, at the time of writing, the author has no position in any stock mentioned in this article and no business relationship with any company mentioned. The author has not received compensation for writing this article, other than from FXStreet.
FXStreet and the author do not provide personalized recommendations. The author makes no representations as to the accuracy, completeness, or suitability of this information. FXStreet and the author will not be liable for any errors, omissions or any losses, injuries or damages arising from this information and its display or use. Errors and omissions excepted.
The author and FXStreet are not registered investment advisors and nothing in this article is intended to be investment advice.
Recommended Content
Editors’ Picks
Ripple's move above this key level could trigger nearly 50% rally for XRP
Ripple has overcome a critical resistance level and flipped into a support floor on the weekly time frame. This development happened while XRP tightly consolidated for roughly 250 days. Investors can expect XRP to kickstart a massive rally.
Optimism price outlook with nearly $90 million worth of OP tokens flooding markets on Friday
Optimism volatility has shrunk in the ours leading to the network’s cliff unlock. It joins the likes of dYdX and Sui, which have similar events on their calendars. As token unlocks are often considered bearish catalysts, investors should brace for a reaction after the event.
Top 3 Price Prediction Bitcoin, Ethereum, Ripple: Retail watches from the sidelines with a bias for shorts
Bitcoin could clear $73,777 peak as BTC bulls resurface. Ethereum might fall 10% before next leg up as ETH RSI teases with sell signal. XRP could lose $0.6000 threshold as Ripple bulls fail to show up.
Jito price could hit $6 as JTO coils up inside this bullish pattern
Jito price action shows a potential cup and handle formation. Based on theoretical measurement rules, a successful breakout could yield a 56% rally to $6.0. A breakdown of the $3.86 support level would create a lower low for JTO and invalidate the bullish thesis.
Bitcoin: BTC may have recovered, but is it out of the woods?
Bitcoin’s (BTC) upward momentum has shown a significant decline for the past two weeks or so. This development led to a bearish signal on the weekly and an uncertain outlook on the monthly.