Shiba Inu has more room to consolidate before SHIB bulls prepare for next explosive rally
- Shiba Inu price is trending sideways as trading volume has significantly declined following its 400% bull run earlier this month.
- If SHIB manages to slice above $0.00002879, bulls could be aiming for an 80% climb.
- However, if the resistance overpowers the bulls, the token may continue to consolidate until further directional bias is revealed.
Shiba Inu price appears to be oscillating within a continuation pattern as SHIB lacks directional clarity following a decline in trading volume. Although the canine-themed token is bolstered by a few crucial technical support levels, the increase in sell orders may lead to a minor retracement before it shows further directional bias.
Shiba Inu price flashes signs of optimism following retracement
Shiba Inu price could retrace further amid the dwindling trading volume compared to the tremendous 400% rally SHIB witnessed earlier this month. The Arms Index (TRIN), which gauges overall market sentiment, has flashed a reading of 1.02, suggesting that there is slightly more selling volume than buying volume.
The prevailing bull pennant chart pattern suggests that if Shiba Inu price slices above the upper boundary of the technical pattern, SHIB may aim for an 80% surge toward $0.00005124. However, until the token manages to slice above the topside trend line that currently acts as resistance, coinciding with the 78.6% Fibonacci retracement level at $0.00002879, it may continue to consolidate and move sideways.
The dog-themed token will discover immediate support at the 50 and 100 four-hour Simple Moving Average (SMA) that meet at $0.00002719. Additional foothold may appear at the ascending support trend line at $0.00002555, which also forms the lower boundary of the bull pennant pattern presented on the 4-hour chart.
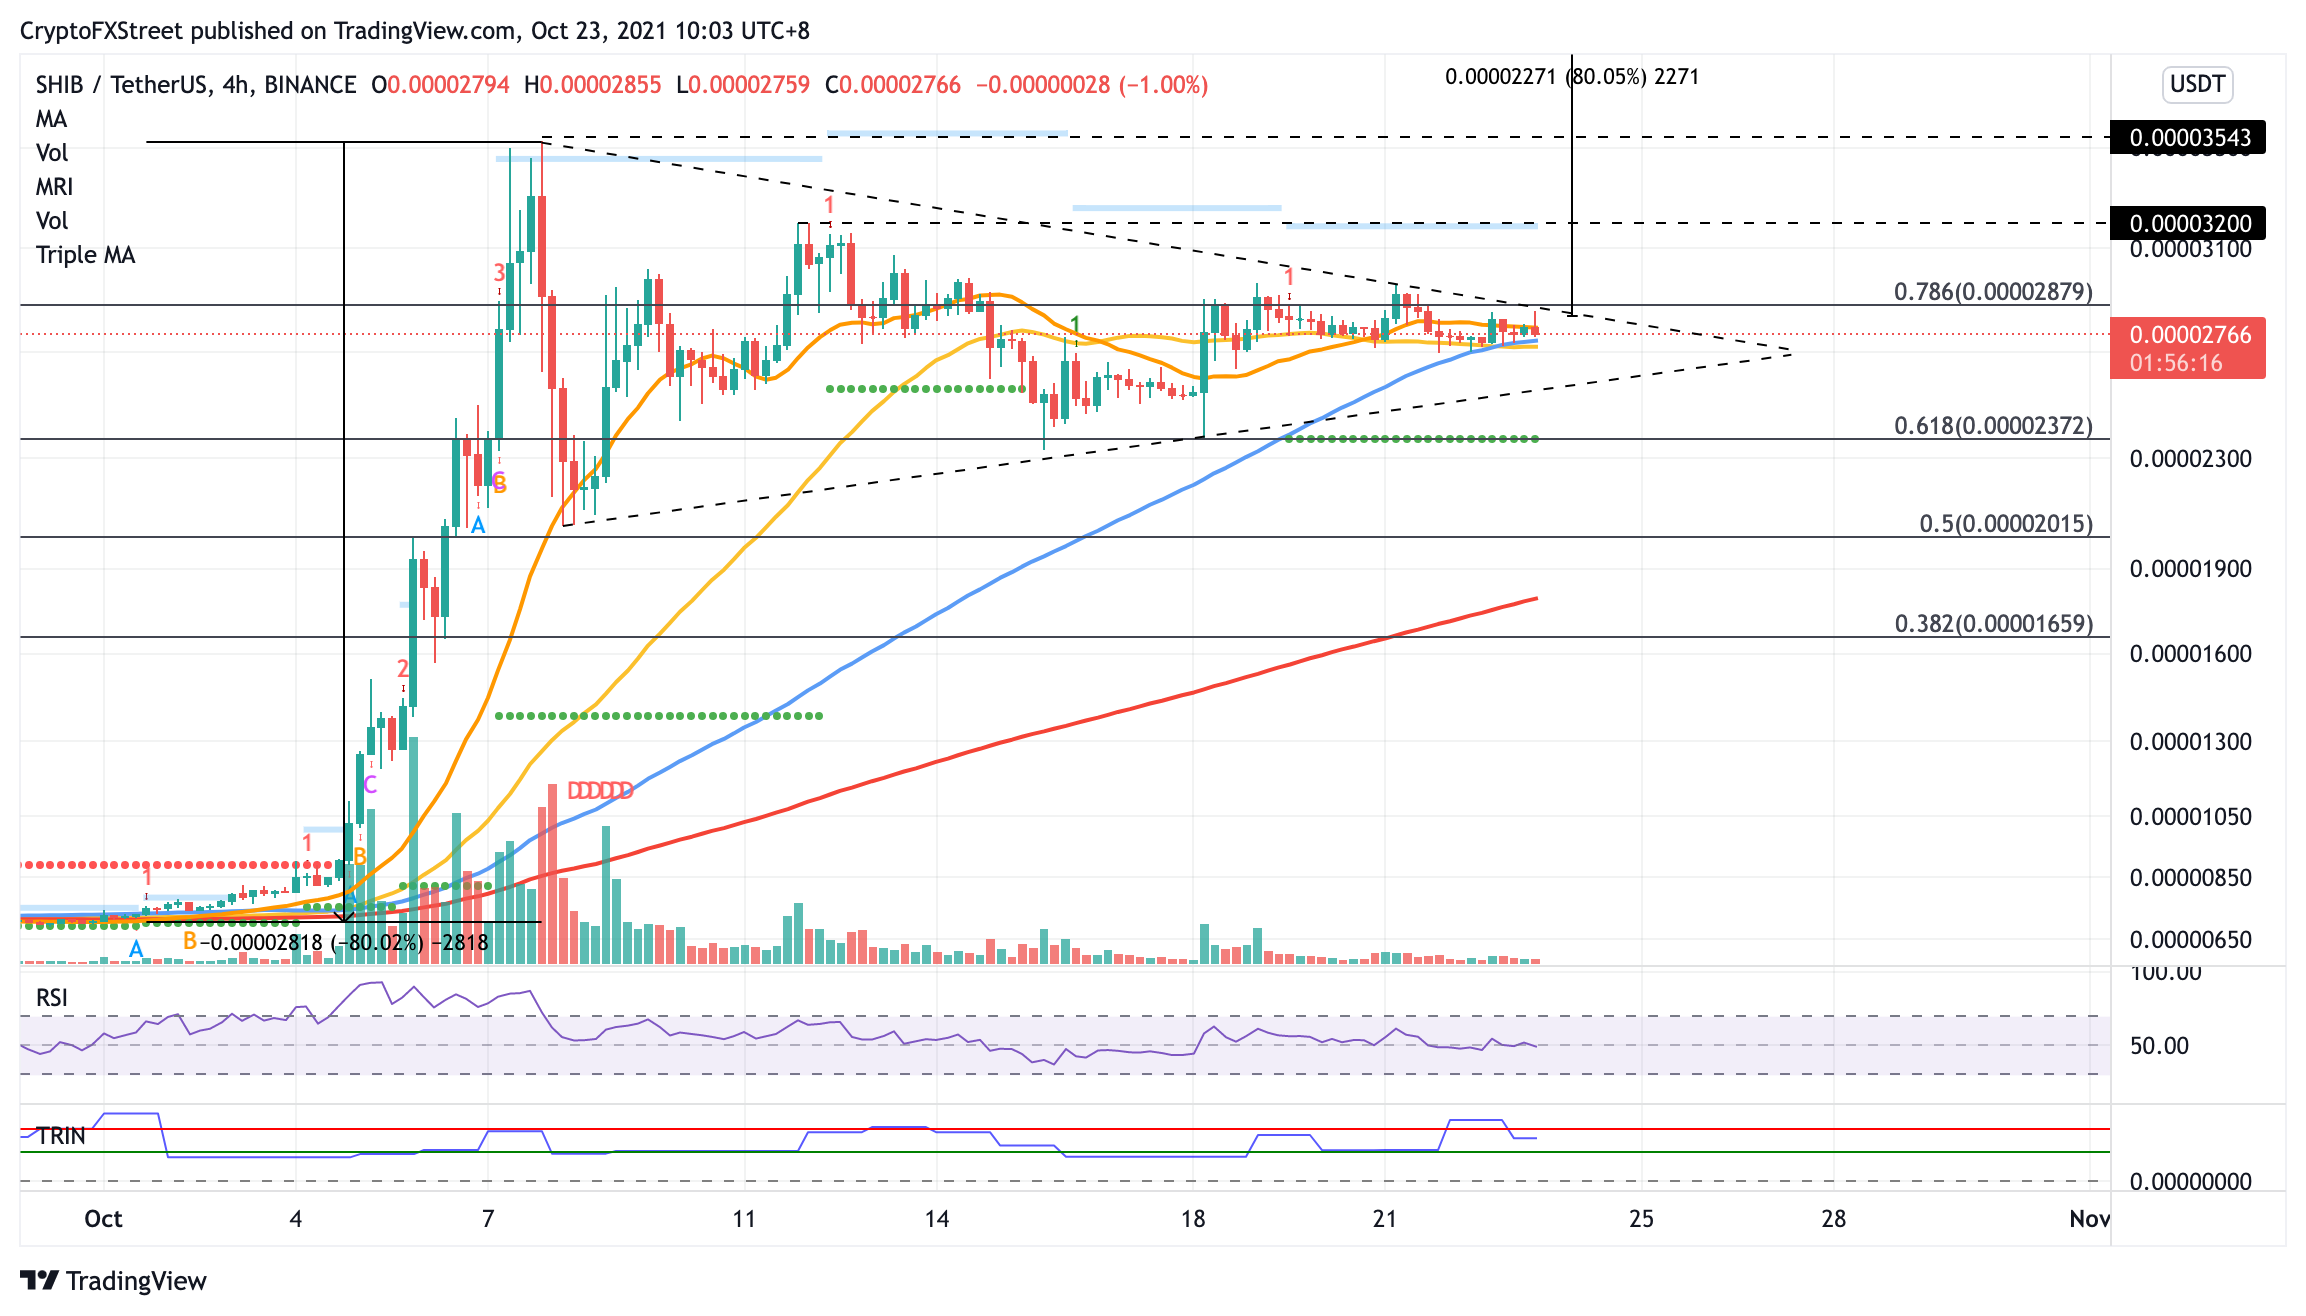
SHIB/USDT 4-hour chart
Should further selling pressure arise, Shiba Inu price may fall toward the 61.8% Fibonacci retracement level at $0.00002372, which corresponds to the support line given by the Momentum Reversal Indicator (MRI). Investors should note that at this point, the bullish outlook given by the prevailing chart pattern may be ruined, but the strength of this foothold should be substantial enough to avoid further losses unless the bears kickstart a selling spree.
If the bulls manage to propel Shiba Inu price higher, breaking above the resistance trend line at $0.00002879, SHIB will face its first obstacle at the October 11 high at $0.00003200, then at the rally high recorded on October 7 at $0.00003543. Only if the token manages to climb above the aforementioned levels, as well as the 127.2% Fibonacci extension level, would see it surge to $0.00005124.
Author

Sarah Tran
Independent Analyst
Sarah has closely followed the growth of blockchain technology and its adoption since 2016.


