Shiba Inu could dip 7% as SHIB whales reduce their holdings
- Shiba Inu’s large wallet investors shed their SHIB token holdings in the last 30 days.
- Retail investors continue to accumulate SHIB in the same timeframe.
- SHIB could correct 7%, and sweep liquidity at $0.00001576 in its decline.

Shiba Inu (SHIB), the second largest meme coin in the crypto ecosystem, edges slightly higher and trades at $0.00001710 at the time of writing on Thursday after a three-day decline. On-chain and technical indicators signal that further correction is likely in the meme coin.
SHIB could sweep liquidity at $0.00001576, the August 5 low for the meme coin.
Shiba Inu could correct for these reasons
Shiba Inu’s large wallet investors holding between 100 million and 1 billion SHIB tokens have shed their holdings between September 10 and October 10. In the last 30 days, there has been a consistent decline in SHIB holdings of different cohorts of holders.
Retail investors holding small quantities continued their accumulation in the same timeframe, according to Santiment data.
 [11.25.41, 10 Oct, 2024]-638641473845702296.png)
Shiba Inu holdings of different wallet addresses
Typically, a decline in holdings of large wallet investors is considered bearish for an asset.
Shiba Inu could correct 7%
Shiba Inu broke above its multi-month downward trend on September 12, as seen in the SHIB/USDT daily chart below. The meme coin could sweep liquidity at the lower boundary of the Fair Value Gap (FVG) between $0.00001576 and $0.00001855.
The decline marks a 7.83% loss from the current level of $0.00001710. Further down, SHIB could find support at $0.00001078, the August 5 low, if the decline is extended.
The Moving Average Convergence/Divergence (MACD) indicator flashes red histogram bars under the neutral line, signaling a negative underlying momentum in the SHIB price trend.
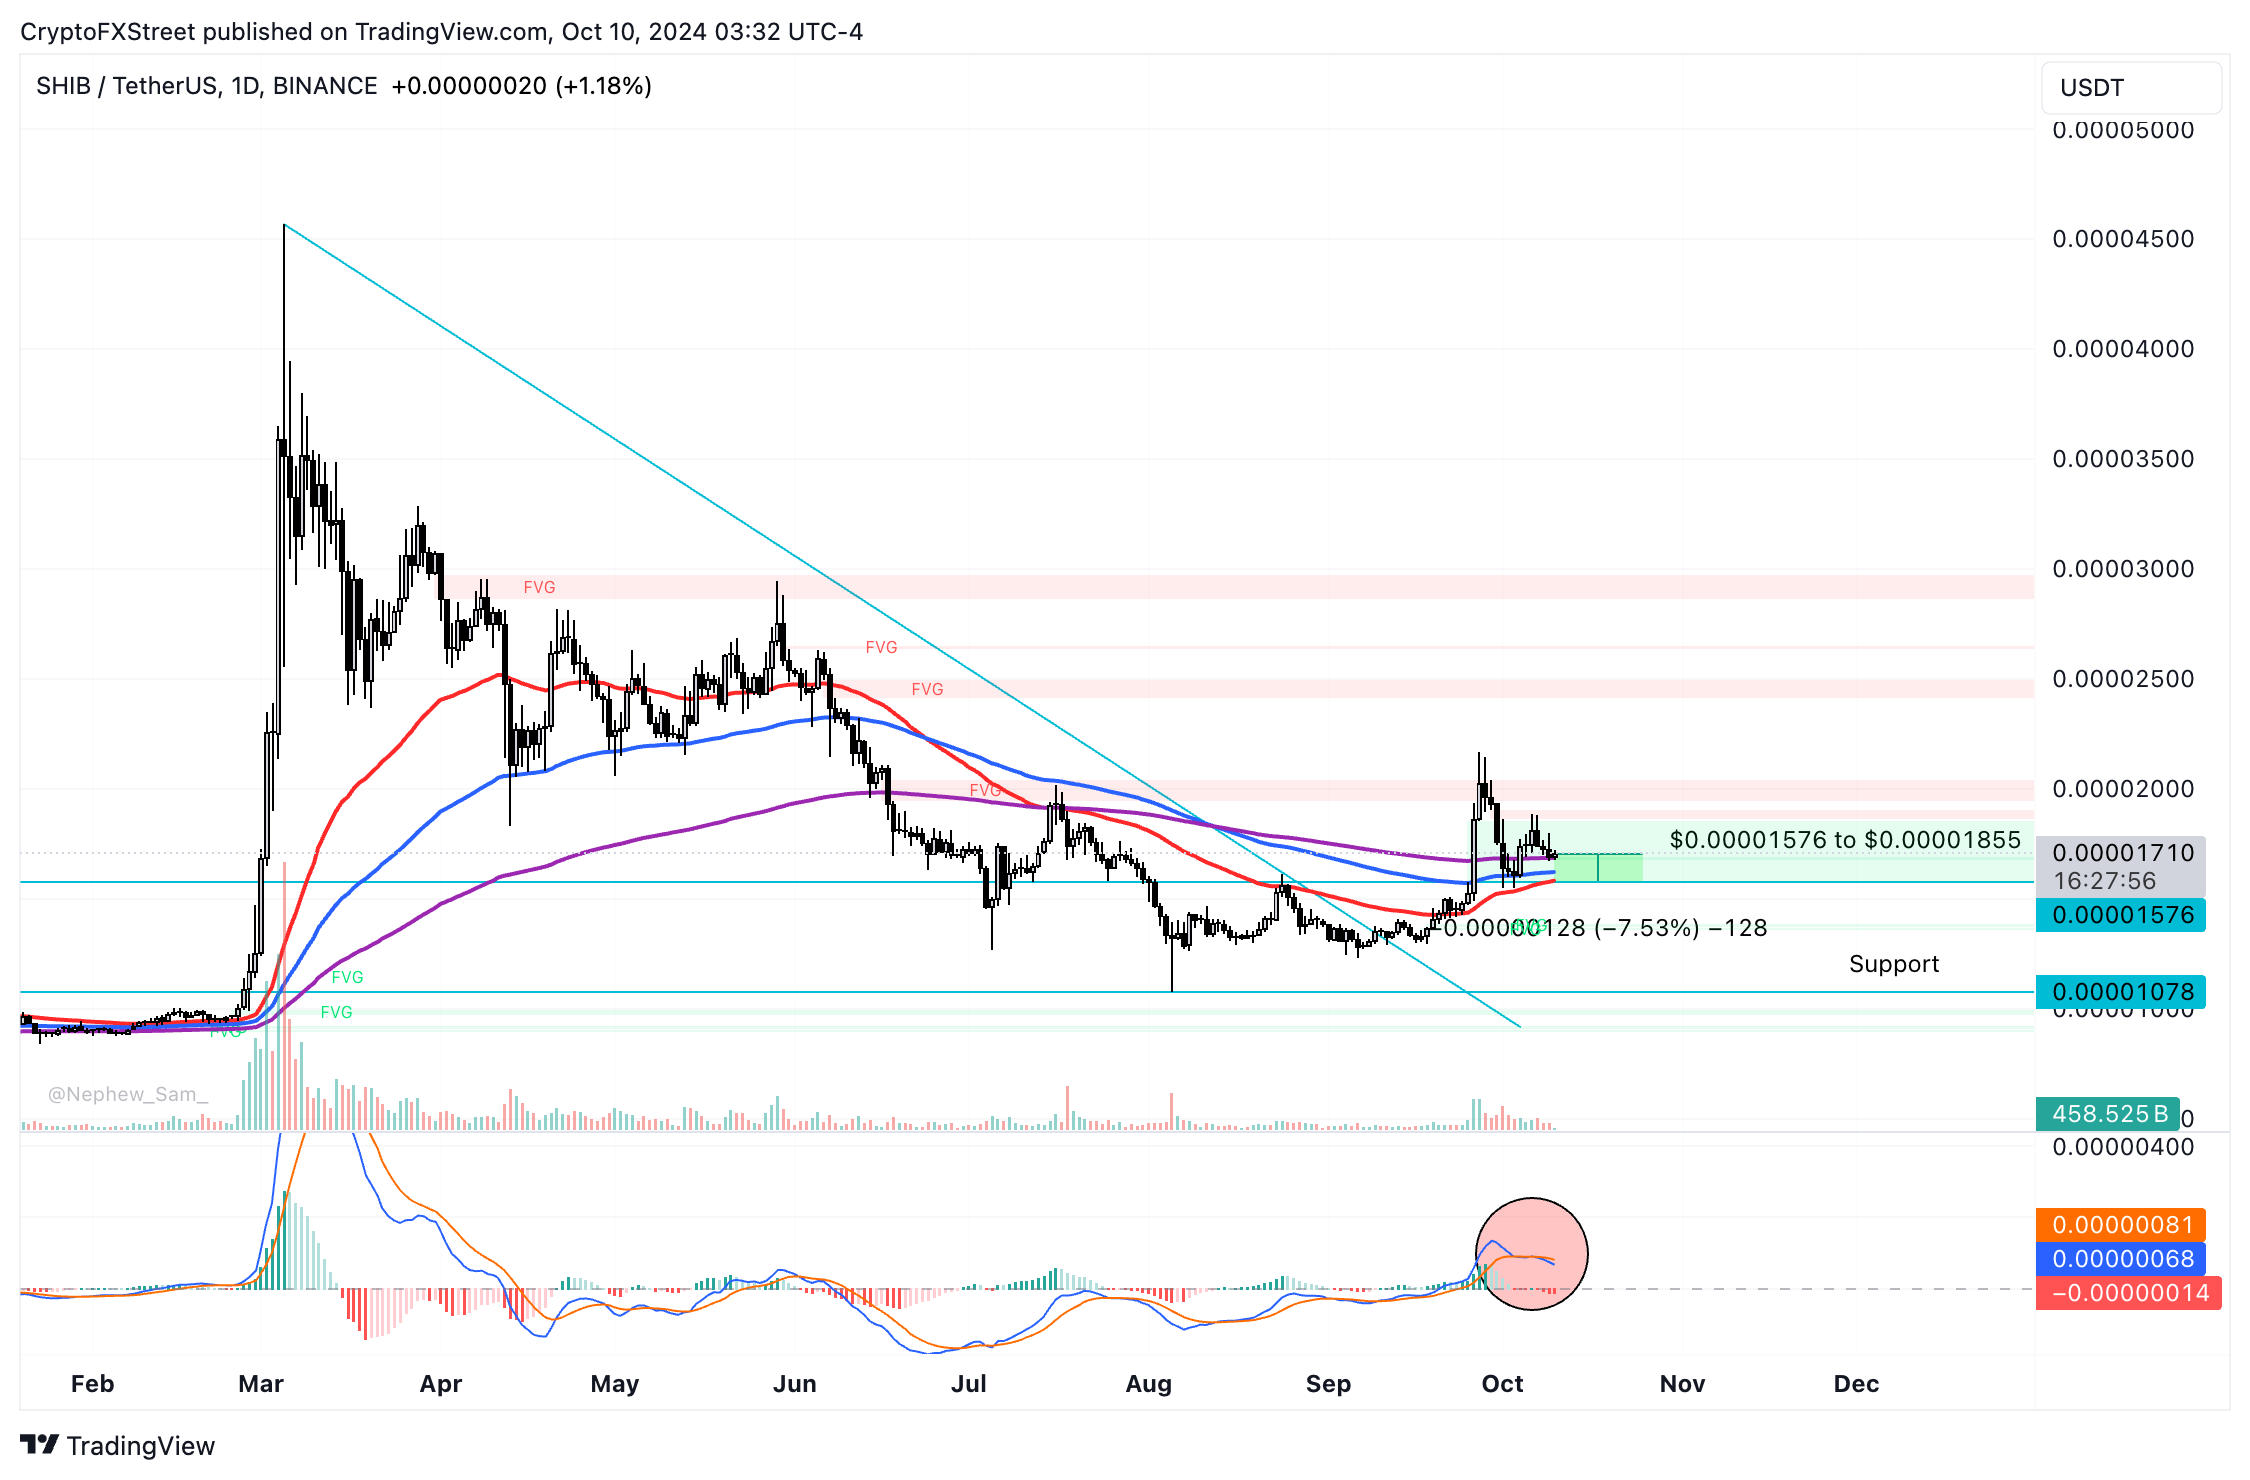
SHIB/USDT daily chart
A daily candlestick close above the upper boundary of the FVG at $0.00001855 could invalidate the bearish thesis. In that case, Shiba Inu could target a return to the September 27 high of $0.00002169.
Author

Ekta Mourya
FXStreet
Ekta Mourya has extensive experience in fundamental and on-chain analysis, particularly focused on impact of macroeconomics and central bank policies on cryptocurrencies.


