|

Shiba Inu and Neo coin Elliott Wave analysis

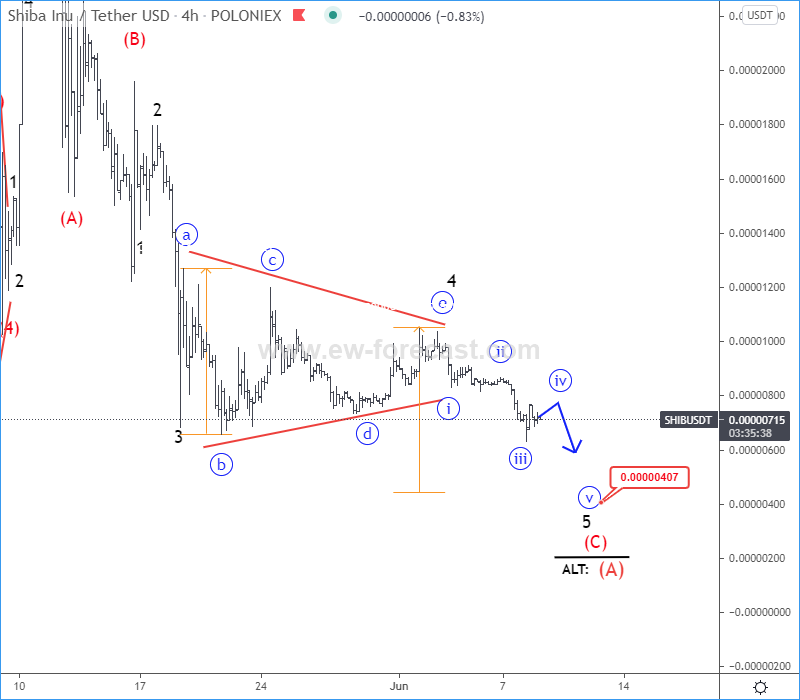
  • Shiba Inu has broken bearish traingle and looks lower towards 0.0000040 area.

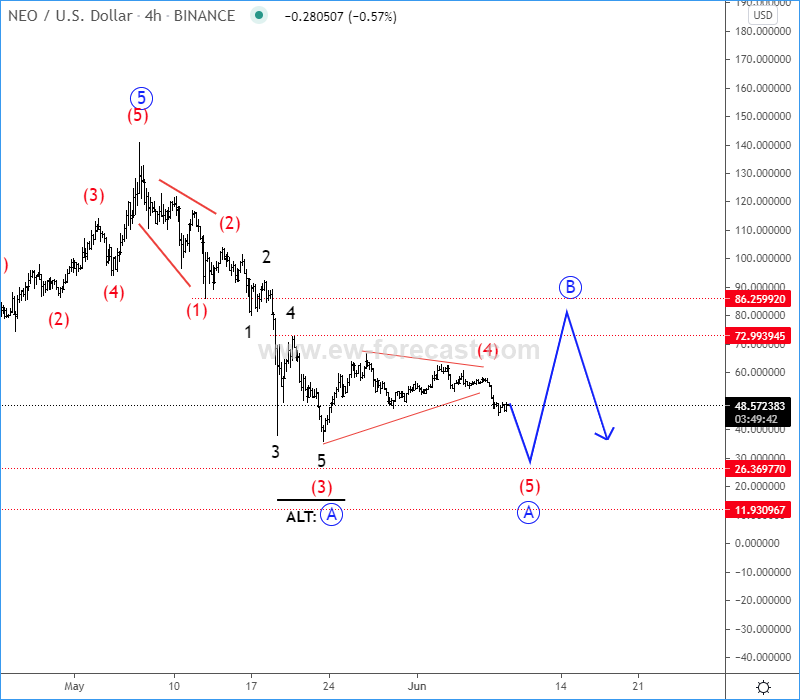
  • Neo moves sideways with in wave (4) correction and can retest the lows for wave (5).

As expected, after we noticed a bearish triangle formation in Shiba Inu (SHIBUSD), it's already back to lows for wave 5, but wave 5 has to be completed with another five-wave cycle of a lower degree, so watch out for more weakness towards 0.0000040 projected triangle target area.

SHIB/USD 4h Elliott Wave analysis chart
Shiba Inu

Neo NEOUSD is slow and sideways and still looks like wave (4) correction which can retest the lows for wave (5) to complete a higher degree wave A before we will see a recovery in wave B. In case of an earlier recovery, then wave B correction would be already in play.

NEO/USD 4h Elliott Wave analysis chart
Neo

Finally, another ELLIOTT WAVE OPEN DOOR Event is here. See all of our charts FREE for 10 days. Join us at Elliot Wave Forecast!

Author

Gregor Horvat

Gregor Horvat

Wavetraders

Experience Grega is based in Slovenia and has been in the Forex market since 2003.

More from Gregor Horvat
Share:

Editor's Picks

Bitcoin steadies at $82,000: The five forces crushing the Uptober rally

Crypto markets have remained under pressure so far in October, with Bitcoin sliding below $80,000 earlier this week before recovering to around $82,000 on Friday, as macroeconomic headwinds and cooling demand weigh on the market.

Ripple bulls build new support base amid RLUSD payments expansion

Ripple ticks up for the second day in a row on Friday, trading at $1.34. The remittance token holds above medium-term structural support; however, strong supply near $1.40 caps upside. A break above this area would reinforce the bullish grip.

Busy week for Ripple’s RLUSD: What changes for stablecoin holders?

Ripple’s RLUSD is gaining ground across institutional finance, with a major bank launching custody services, a new wallet integration making it easier for developers to build payments and agentic experiences on the network, and a brokerage platform planning to use the stablecoin for settlement.

Bitcoin Weekly Forecast: Macroeconomic headwinds, cooling demand cap BTC gains

Bitcoin extends its correction this week, trading below $82,500 on Friday, as selling pressure continues. Hotter-than-expected US CPI and PPI data point to broader inflation pressures and persistent geopolitical uncertainty, weighing on risk sentiment.

Bitcoin: Macroeconomic headwinds, cooling demand cap BTC gains
Bitcoin (BTC) extends losses this week, trading below $82,500 as of Friday as selling pressure continues. Weakening institutional demand supports this pullback as BTC spot Exchange-Traded Funds (ETFs) are on track to record a two-week withdrawal streak, reaching $146.19 million in net outflows through Thursday.


