SHIB holders withhold selling even as Shiba Inu price crashes, set sights on profits at this level
- Shiba Inu price dipped by 10% this week following Bitcoin’s lead after charting monthly highs.
- SHIB holders have been awaiting profits, holding more than 48 trillion SHIB for more than a month.
- Nearly $2.59 billion worth of SHIB would be susceptible to selling if the meme coin breaches the "danger zone".

Shiba Inu price is sticking to the broader market cues as it noted a decline this week. But for the first time in a very long time, its investors did not jump ship at the first sight of a red candle and held on to their SHIB. The reason behind this HODLing by investors is to make a profit still, but it also supports the stability of the altcoin.
Shiba Inu price misses the mark again
Shiba Inu price has been attempting to breach a key barrier for nearly two months now. The resistance level at $0.00001169, if flipped into support, would trigger a recovery to $0.00001200, which is the price point most investors have been waiting for SHIB to climb back to.
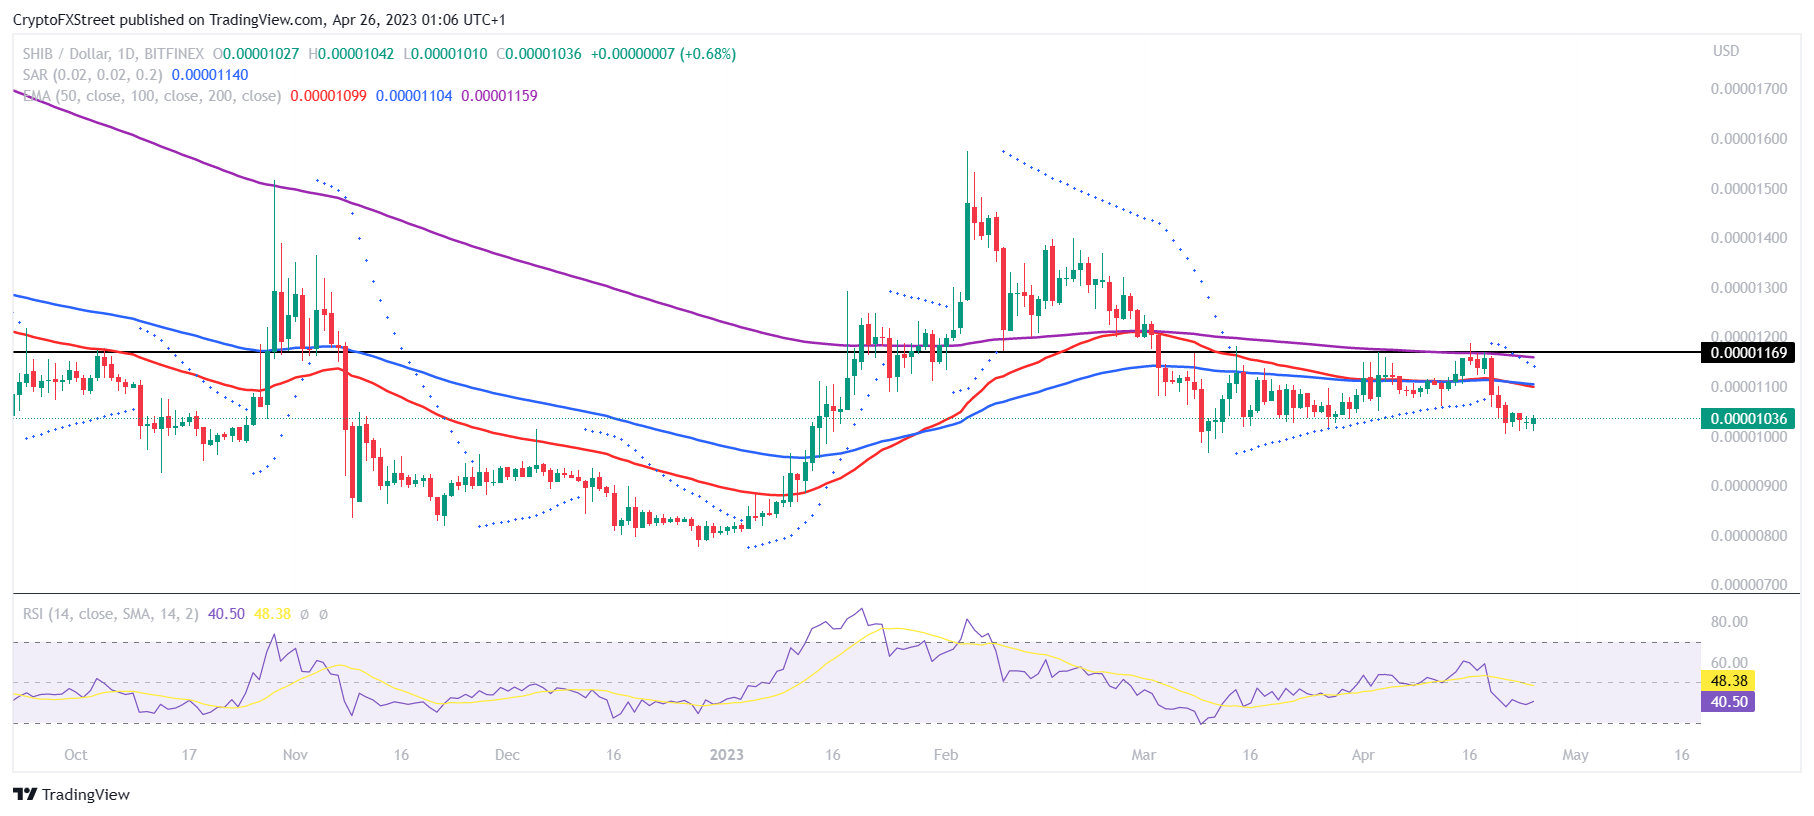
SHIB/USD 1-day chart
The reason behind this wait is that the investors that bought their Shiba Inu between $0.00001100 and $0.00001400 will find profit once the aforementioned resistance level is hit. Over 250 trillion SHIB, worth $2.59 billion at the current prices, will turn profitable as the average price they were bought at is $0.00001200.
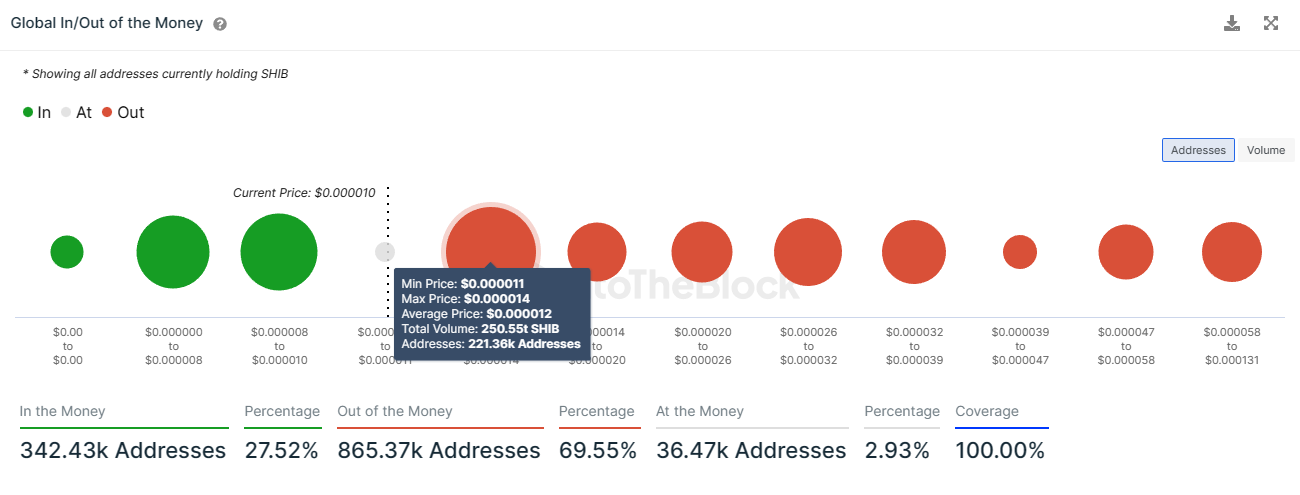
Shiba Inu GIOM
The wait for the same has filled investors with confidence in a recovery to the point that more than 48 trillion SHIB worth about half a billion dollars has been held by the investors for more than a month now.
This is reflected in the balance in the addresses that are known to hold their supply for anywhere between a month to a year. In the 48 hours following April 20, the 48 trillion SHIB changed hands from “Traders” who had been holding it for less than a month to “Cruisers”.
This indicated that despite the 10.45% crash observed this week, investors have confidence in the Shiba Inu price to chart a recovery soon.
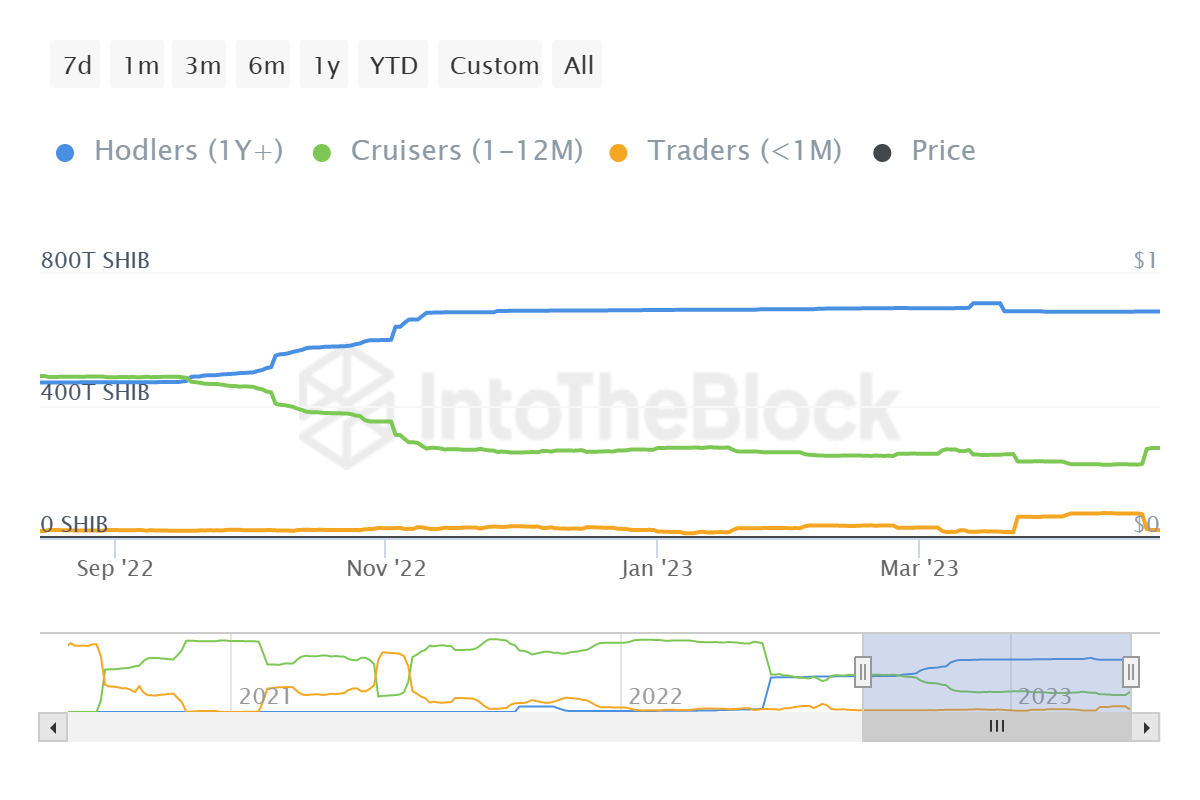
Shiba Inu addresses by time
Furthermore, the altcoin is not facing any sudden selling noted on the Market Value to Realized Value (MVRV ratio)as the indicator is below the neutral line at -4.9%. The indicator represents whether investors are at a profit or loss. The MVRV ratio also signals the possible moment when the investors could cash out.
 [05.31.50, 26 Apr, 2023]-638180656933552728.png)
Shiba Inu MVRV ratio
As noted on the 30-day MVRV ratio, every time the indicator breaches above 6%, the altcoin has observed declines in price. This was also the case on April 19, after which Shiba Inu price fell by 10%.
This zone is known as the “danger zone”, and investors could potentially cash out when SHIB is in this zone. Thus, should SHIB note a recovery and climb back above $0.00001200 and the MVRV ratio touches 6%, some selling can be expected.
Author

Aaryamann Shrivastava
FXStreet
Aaryamann Shrivastava is a Cryptocurrency journalist and market analyst with over 1,000 articles under his name. Graduated with an Honours in Journalism, he has been part of the crypto industry for more than a year now.