- Sei price has shed 35% in under six days, due to excessive selling pressure.
- After a liquidity run below the $0.585 swing low, SEI triggered a 13% recovery rally.
- Going forward, the $0.690 and $0.701 resistance levels will be pivotal in determining the trend going forward.
- Rejection at $0.690 or $0.701 that leads to a production of a lower low below $0.562 will invalidate the bullish thesis.
Sei price shows a good sign of recovery after sweeping a key swing low. This move indicates that bulls are vying for higher prices. However, the pullback rally will not be simple due to key hurdles.
Readmore: Sei price could rally 20% as SEI bulls mount a comeback
Sei price recovery rally kickstarts
Sei price underwent a steep correction of 35% in less than six days, pushing it from $0.874 to $0.562. In the process of this sell-off, SEI swept below a key swing point of $0.585, triggering a short-term spike in buying pressure. As a result, the altcoin inflated by 13% and currently trades at $0.637.
The $0.585 is a key swing low because it is a higher high in the long-standing uptrend that failed to produce a higher high and has now produced a lower low as well. While this development could mean the start of a downtrend, it could also reflect a short squeeze.
Regardless, the bounce in Sei price will encounter two key hurdles at $0.690 and $0.701 after a 10% move. If buyers push higher and flip these resistance levels into a support floor, it will indicate an active short squeeze, and likely propel the altcoin higher.
In such a case, Sei price could attempt to sweep the equal highs buy-side liquidity resting above $0.884. This move would constitute a nearly 40% rally from the current position.
Also read: Week Ahead: This week’s altcoin narrative and Bitcoin's fourth halving targets
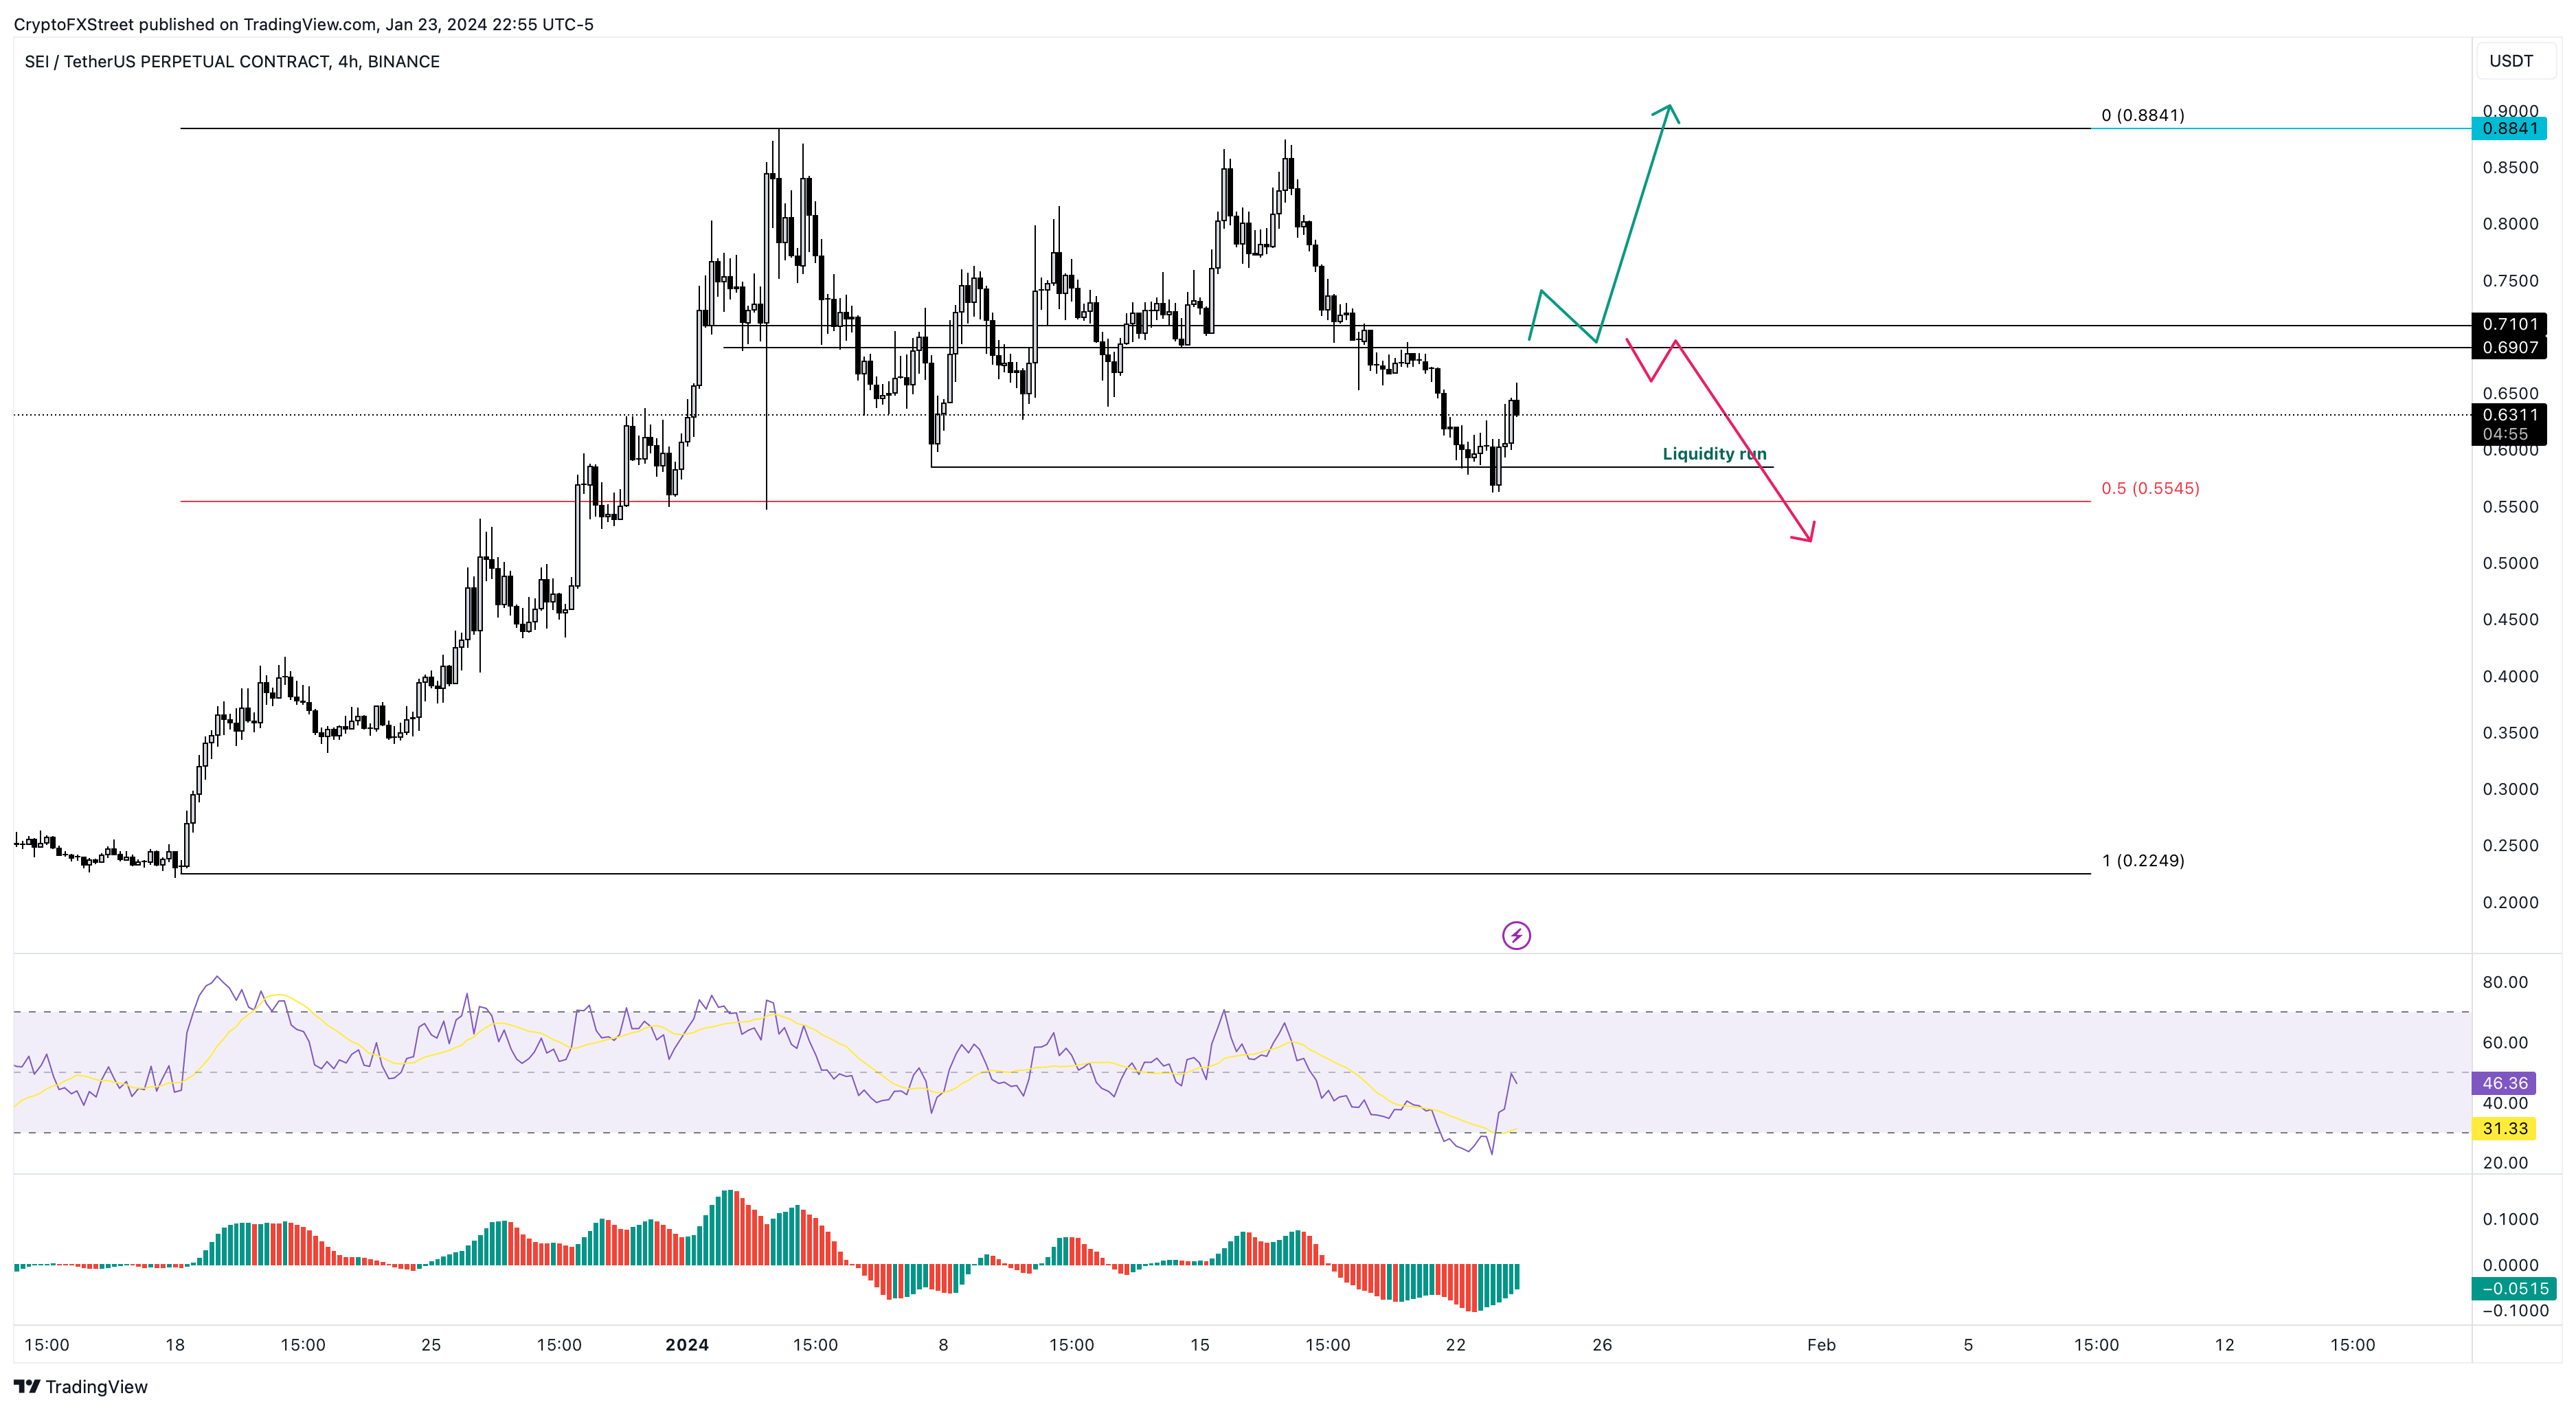
SEI/USDT 4-hour chart
On the other hand, if Sei price recovery rally faces the $0.690 and $0.701 hurdles and fails to overcome them, it would create a lower low. This development is indicative of a potential reversal and a spike in selling pressure that is likely to push SEI lower.
If Sei price produces a decisive four-hour candlestick close below $0.562, it will create a lower low and invalidate the bullish thesis. In such a case, the altcoin will encounter the stable support level at $0.554, which is the midpoint of the 300% rally witnessed between December 18, 2023, and January 3, 2024.
Also read: Grayscale’s Bitcoin sale unlikely to have driven BTC price lower, profit taking is likely driver
Information on these pages contains forward-looking statements that involve risks and uncertainties. Markets and instruments profiled on this page are for informational purposes only and should not in any way come across as a recommendation to buy or sell in these assets. You should do your own thorough research before making any investment decisions. FXStreet does not in any way guarantee that this information is free from mistakes, errors, or material misstatements. It also does not guarantee that this information is of a timely nature. Investing in Open Markets involves a great deal of risk, including the loss of all or a portion of your investment, as well as emotional distress. All risks, losses and costs associated with investing, including total loss of principal, are your responsibility. The views and opinions expressed in this article are those of the authors and do not necessarily reflect the official policy or position of FXStreet nor its advertisers. The author will not be held responsible for information that is found at the end of links posted on this page.
If not otherwise explicitly mentioned in the body of the article, at the time of writing, the author has no position in any stock mentioned in this article and no business relationship with any company mentioned. The author has not received compensation for writing this article, other than from FXStreet.
FXStreet and the author do not provide personalized recommendations. The author makes no representations as to the accuracy, completeness, or suitability of this information. FXStreet and the author will not be liable for any errors, omissions or any losses, injuries or damages arising from this information and its display or use. Errors and omissions excepted.
The author and FXStreet are not registered investment advisors and nothing in this article is intended to be investment advice.
Recommended Content
Editors’ Picks

Storj Price Forecast: Bulls aiming for double-digit gains
Storj (STORJ), an open-source platform that leverages the blockchain to provide end-to-end encrypted cloud storage services, continues to trade higher by 4.4%, around $0.39 on Tuesday after rallying 5% the previous day.

XRP declines below $2.72 key level as Elon Musk's DOGE to begin SEC examination
Ripple's XRP saw a 4% decline in the early Asian session on Tuesday following an announcement that the Department of Government Efficiency is targeting the Securities and Exchange Commission (SEC) as the next agency to face its examination process.

FTX repayments stir mixed feelings among investors, sending Bitcoin and Solana down
Bitcoin (BTC) and Solana (SOL) experienced declines on Monday as defunct crypto exchange FTX will begin redistributing tokens owed to creditors from its collapse in 2022, starting with those who held $50,000 or less.

Toncoin Price Analysis: TON nears $4 as LTC and DOGE ETF hype lifts PoW sector
Toncoin price has consolidated within the 2% tight range between $3.8 - $4 over the last 12 days.

Bitcoin: BTC consolidates before a big move
Bitcoin price has been consolidating between $94,000 and $100,000 for the last ten days. US Bitcoin spot ETF data recorded a total net outflow of $650.80 million until Thursday.

The Best Brokers of the Year
SPONSORED Explore top-quality choices worldwide and locally. Compare key features like spreads, leverage, and platforms. Find the right broker for your needs, whether trading CFDs, Forex pairs like EUR/USD, or commodities like Gold.