• SafeMoon is in a technical triangle play to the upside.
  • $0.00000300 is forming a triple top and will be hard to break above.
  • Favorable tailwinds in cryptocurrencies should help SAFEMOON.

SafeMoon price (SAFEMOON) has been on a very subdued recovery path as the more significant cryptocurrencies could recover much more ground to the upside this week. The trend seems to have kicked into high gear since August 16 when SafeMoon almost touched $0.00000100 to the downside. 

Price action was able to find some buyers, and SAFEMOON is since then in a triangle play upwards with the green ascending trend line being used as a backbone for the rally. In the meantime, SafeMoon was able to recover and take out the 21-day Simple Moving Average (SMA). That same SMA is today acting as support for the price action and the green ascending trend line and is keeping SafeMoon in rally mode.

SafeMoon has 35% upside potential if it can keep this rally going

The next part to face will be the resistance of the 55-day SMA. That has been a difficult one to break to the upside as it was attempted on August 23. Although the price shot above the 55-day SMA, buyers could not keep the candle above it. It makes the level a difficult one to cross. For now, that level is around $0.00000260 and isa critical level to watch.

Of course, the big target to the upside is $0.00000300, which was formed on July 26. As of that day, SafeMoon was not able to trade above that price. An attempt was made on July 27 and August 7, but both attempts failed and made the price run lower. This level has considerable importance for short-sellers who entered there and have their stops safely tucked above $0.00000300.

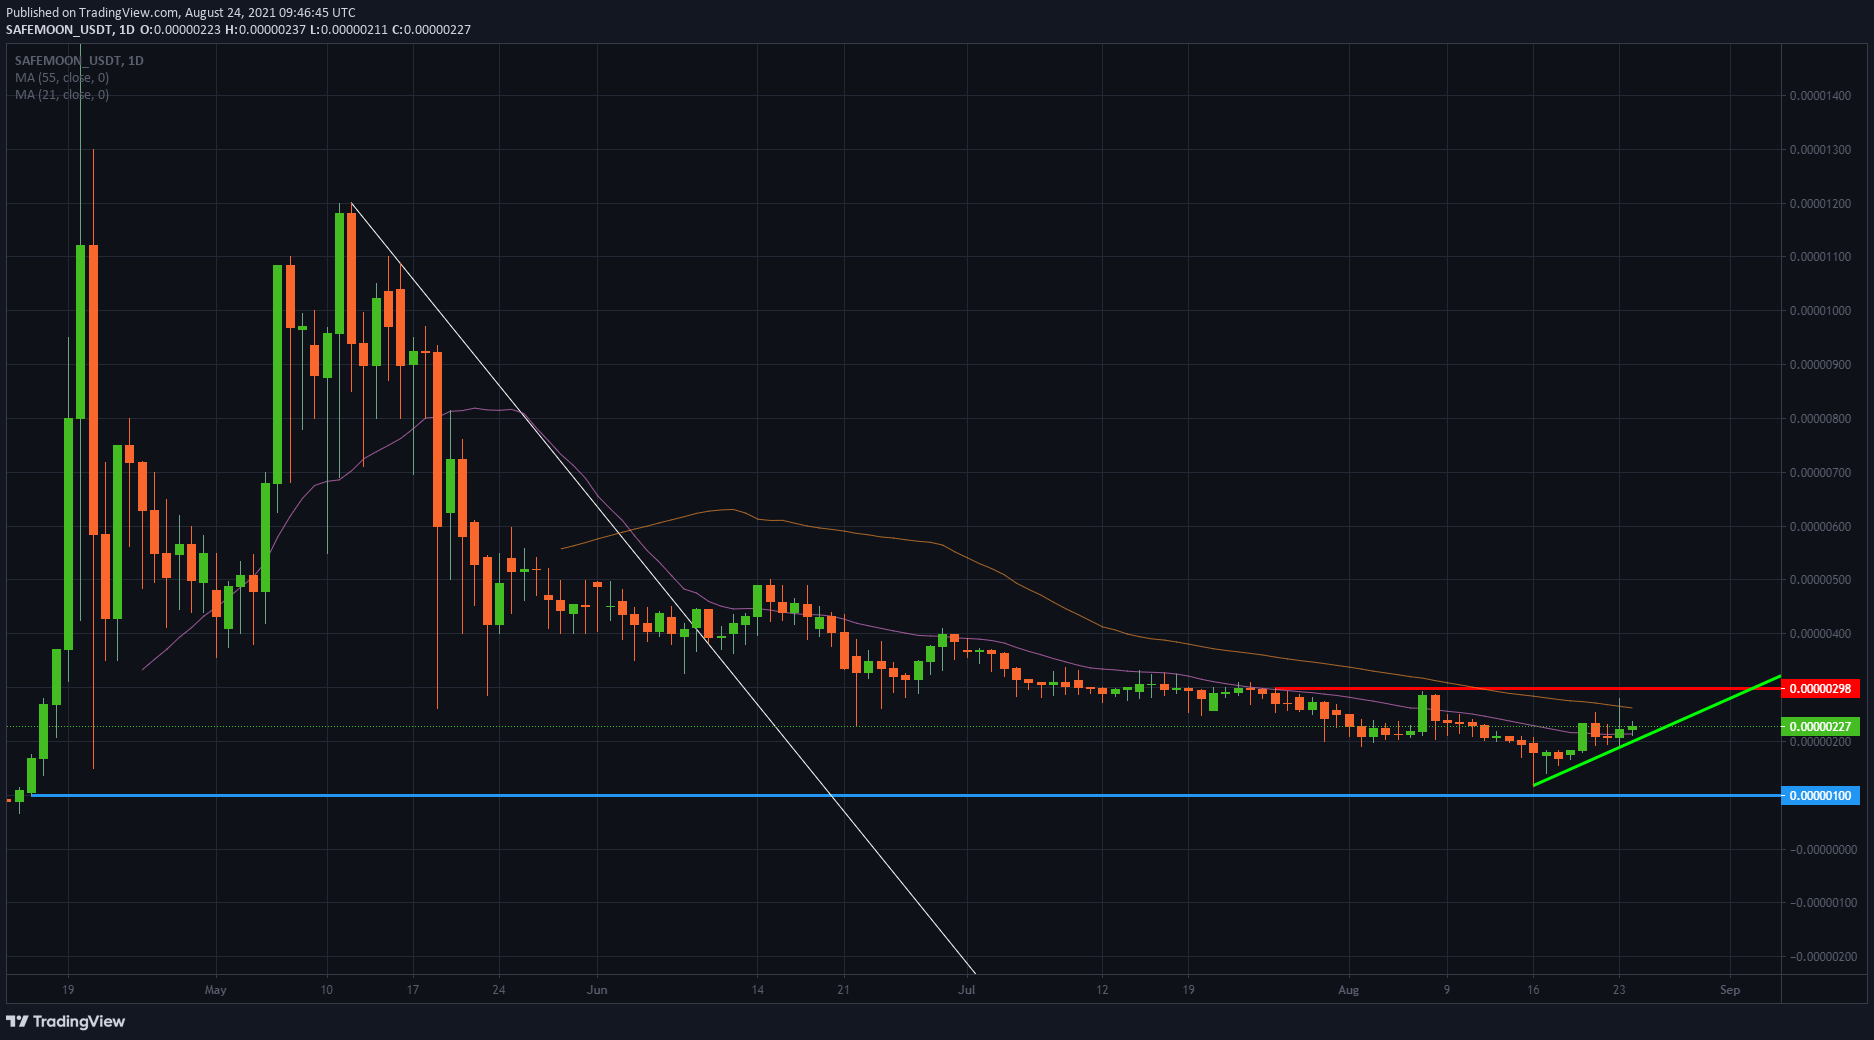
SafeMoon/USD daily chart

Expect a big battle between buyers and sellers by the end of this week toward $0.00000300. With the favorable tailwind in the cryptocurrency markets and renewed attention in the media for Bitcoin, SafeMoon should monetize on that attention. Price action will shoot through $0.00000300 to take out most of the stops from short sellers, but once that has happened, expect possible price action to either return to test $0.00000300 or even dip below back to the green ascending trend line.

Should the green ascending trend line break, expect a push further down toward $0.00000100 in the coming weeks as sellers will be in control of the price action.


Information on these pages contains forward-looking statements that involve risks and uncertainties. Markets and instruments profiled on this page are for informational purposes only and should not in any way come across as a recommendation to buy or sell in these assets. You should do your own thorough research before making any investment decisions. FXStreet does not in any way guarantee that this information is free from mistakes, errors, or material misstatements. It also does not guarantee that this information is of a timely nature. Investing in Open Markets involves a great deal of risk, including the loss of all or a portion of your investment, as well as emotional distress. All risks, losses and costs associated with investing, including total loss of principal, are your responsibility. The views and opinions expressed in this article are those of the authors and do not necessarily reflect the official policy or position of FXStreet nor its advertisers. The author will not be held responsible for information that is found at the end of links posted on this page.

If not otherwise explicitly mentioned in the body of the article, at the time of writing, the author has no position in any stock mentioned in this article and no business relationship with any company mentioned. The author has not received compensation for writing this article, other than from FXStreet.

FXStreet and the author do not provide personalized recommendations. The author makes no representations as to the accuracy, completeness, or suitability of this information. FXStreet and the author will not be liable for any errors, omissions or any losses, injuries or damages arising from this information and its display or use. Errors and omissions excepted.

The author and FXStreet are not registered investment advisors and nothing in this article is intended to be investment advice.

Join Telegram

Recommended content


Recommended Content

Editors’ Picks

Ripple wipes out weekly gains, experts comment on role of Ripple stablecoin

Ripple wipes out weekly gains, experts comment on role of Ripple stablecoin

Ripple declined to $0.52 on Thursday, erasing all gains registered earlier this week. Ripple SVP Eric van Miltenburg’s comments on the firm’s stablecoin, and how it is expected to benefit the XRP Ledger and native token XRP have raised concerns among crypto experts. 

More Ripple News

Hedera HBAR slips nearly 10% after air is cleared on mistaken link with giant BlackRock

Hedera HBAR slips nearly 10% after air is cleared on mistaken link with giant BlackRock

HBAR price is down nearly 10% on Thursday, partly erasing gains inspired by the misinterpreted link with BlackRock. Despite the recent correction, Hedera’s price is up 44% in the past seven days.

More Hedera News

The reason behind Bonk’s 105% rise and if you should buy now Premium

The reason behind Bonk’s 105% rise and if you should buy now

Bonk price has shot up 105% in the past five weeks. A retracement into $0.0000216 or the $0.0000152 to $0.0000186 imbalance would be a good buying opportunity. Patient investors can expect double-digit gains from BONK that could extend up to 70%.

More Cryptocurrencies News

Injective price weakness persists despite over 5.9 million INJ tokens burned

Injective price weakness persists despite over 5.9 million INJ tokens burned

Injective price is trading with a bearish bias, stuck in the lower section of the market range. The bearish outlook abounds despite the network's deflationary efforts to pump the price. Coupled with broader market gloom, INJ token’s doomed days may not be over yet.

More Injective News

Bitcoin: BTC post-halving rally could be partially priced in Premium

Bitcoin: BTC post-halving rally could be partially priced in

Bitcoin (BTC) price briefly slipped below the $60,000 level for the last three days, attracting buyers in this area as the fourth BTC halving is due in a few hours. Is the halving priced in for Bitcoin? Or will the pioneer crypto note more gains in the coming days? 

Read full analysis

BTC

ETH

XRP