SafeMoon price changes course, SAFEMOON to chase better outcomes
- SafeMoon price triggers bullish hammer candlestick pattern on August 20 with a 27.32% jump.
- SAFEMOON trying to hold a position on the dominating 20-day simple moving average (SMA).
- SafeMoon price remains below the crucial May 19 low of $0.00000261.

SafeMoon price nearly reached the measured move target of the descending triangle pattern at $0.00000111 on August 16 before closing with a bullish hammer candlestick pattern, establishing a timely entry price for eager SAFEMOON speculators at $0.00000207. The cosmic token activated the candlestick pattern on August 20 and has raised the probability it can scale higher prices.
SafeMoon price may not lag for much longer
SafeMoon price fell 44% at the August 16 low, amping the anxiety in SAFEMOON speculators, but it staged a significant rebound, closing down only -7.69%. The digital coin proceeded to log three consecutive tight closes before the 27.32% jump on August 20, triggering the bullish hammer candlestick pattern and closing above the 20-day SMA at $0.00000214.
SafeMoon price now encounters three more points of resistance before it can comfortably target higher prices with impulsiveness. The first point of resistance is the 50-day SMA at $0.00000257, followed by the May 19 low of $0.00000261 and finally, the August 7 high of $0.00000293.
The potential upside targets for a sustainable SafeMoon price rally include the June 29 high of $0.00000410. If SAFEMOON commands commitment, it could tag the June 15 high of $0.00000500, representing a 70.65% gain from the August 8 high of $0.00000293.
It is essential to point out that SafeMoon price is not actionable until it trades above the August 7 high of $0.00000293. Otherwise, SAFEMOON market operators risk being tossed around by the key resistance levels addressed above.
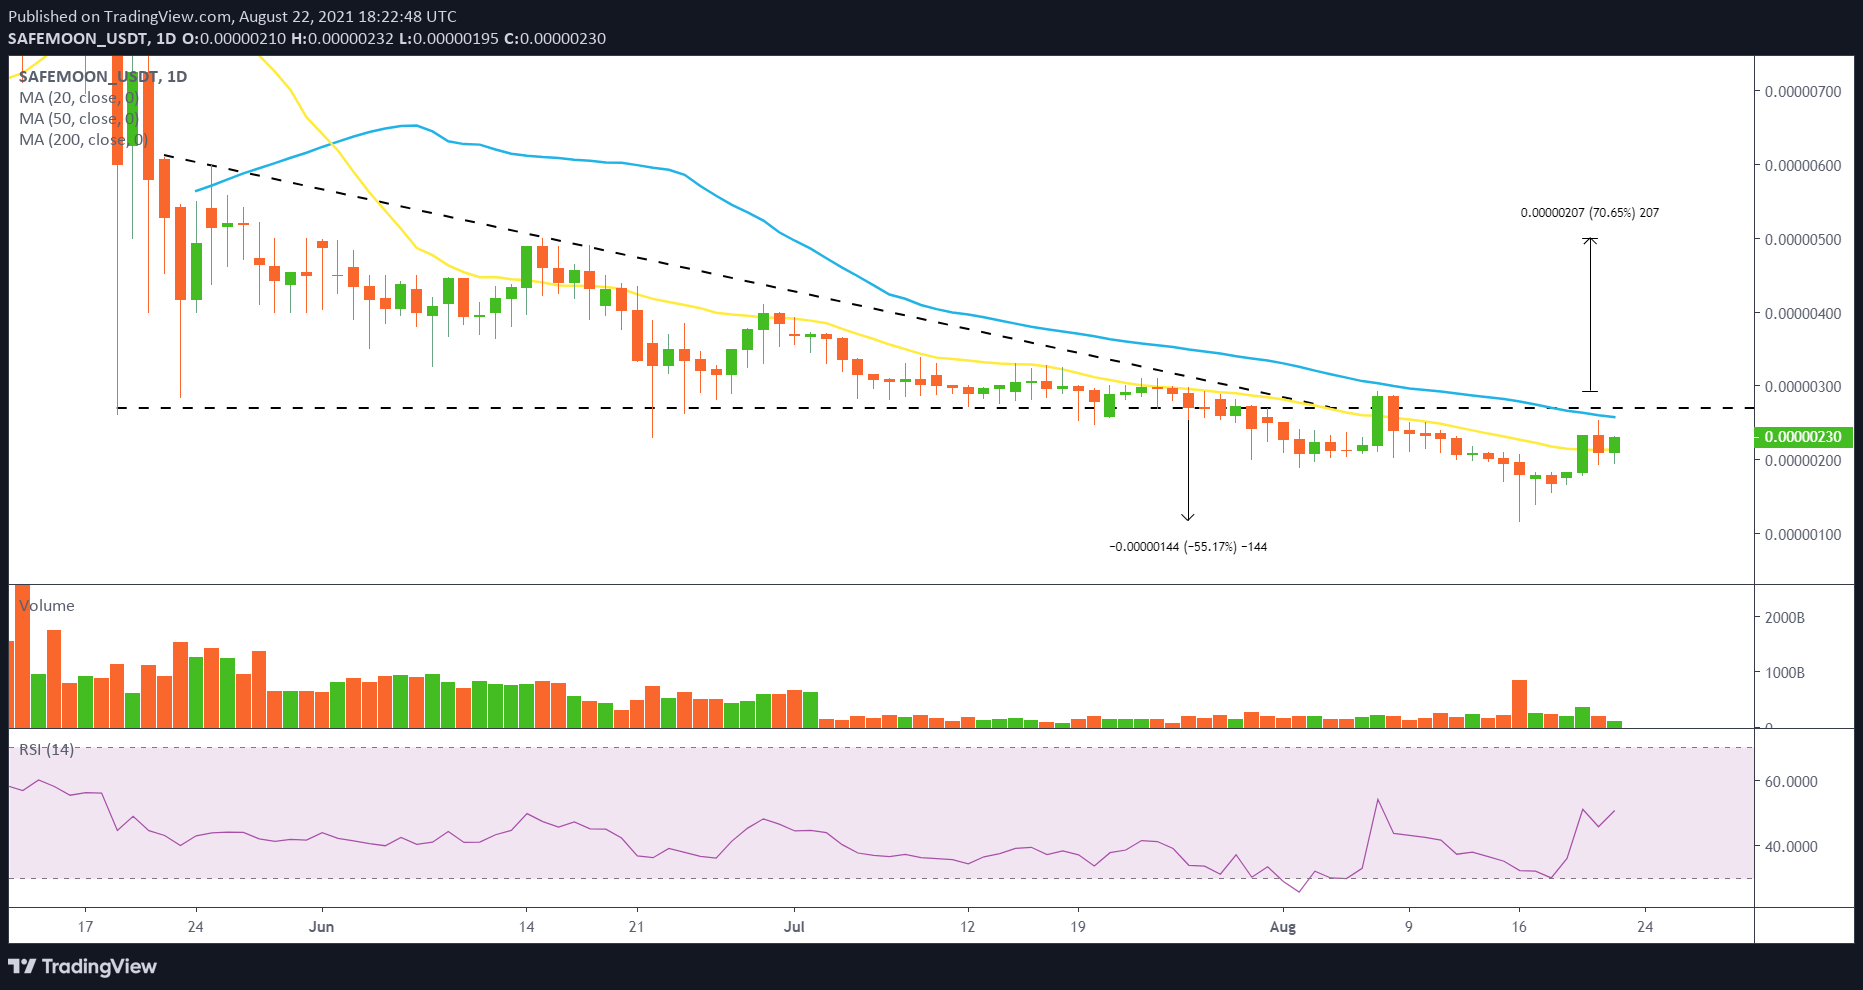
SAFEMOON/USD daily chart
A failure to maintain support on the 20-day SMA and a close below the August 20 low would point to a resumption of the SafeMoon price decline and a test of the August 16 low of $0.00000117.
SAFEMOON has notably underperformed the broader cryptocurrency market, as it is confronted by an unusual transaction fee structure and the absence of tangible, real-world use at this point. Nevertheless, the SafeMoon price drop to the measured move target may have rid the altcoin of the remaining weak holders from the May collapse, strengthening it for the first sustainable uptrend in months.
Here, FXStreet's analysts evaluate where SAFEMOON could be heading next after breaking out of a descending wedge.
Author

Sheldon McIntyre, CMT
Independent Analyst
Sheldon has 24 years of investment experience holding various positions in companies based in the United States and Chile. His core competencies include BRIC and G-10 equity markets, swing and position trading and technical analysis.


