Share:
  • SafeMoon price has been stuck in consolidation since May 23, failing to galvanize investors’ enthusiasm.
  • A reversal of a month of underperformance seems unlikely, given the prevailing downward trend. 
  • SAFEMOON aspirations of a rally show little optimism with strong obstacles ahead.  

SafeMoon price has remained locked in a sideways trend that started on May 23 and sees scarce optimism of reversing the period of underperformance. SAFEMOON is trapped in a downtrend, as the cryptocurrency continues to mark lower lows and lower highs.

SafeMoon price trapped in tight range

SafeMoon price action has been uneventful, forming a descending parallel channel on the 4-hour chart. By joining together the swing highs and the swing lows, two parallel trend lines can be drawn, forming the chart pattern. 

While the prevailing direction of SafeMoon price appears to be sideways, the consistent lower lows presented by SAFEMOON suggest that the asset is consolidating toward the downside. 

SafeMoon price broke below the lower trend line of the parallel channel on June 22, resulting in a 32% drop and reaching a reaction low at $0.00000232. 

While SAFEMOON lost the lower barrier of the chart pattern as support, a target can be measured for the asset by drawing a parallel channel adjacent to the existing pattern.This would give the SafeMoon price an expected decline of 27%. 

Although the lower barrier of the second parallel channel was breached, SafeMoon price managed to quickly recover in tandem with the broader cryptocurrency market, led by Bitcoin.

Currently, the 27.2% Fibonacci retracement level acts as the first line of defense for SAFEMOON at $0.00000328. 

If SafeMoon price fails to sustain trading above this level and also breaks below the lower boundary of the first descending parallel channel, SAFEMOON is likely to tag the middle boundary of the second chart pattern below, effecting a 20% decline toward $0.00000274. 

Safemoon

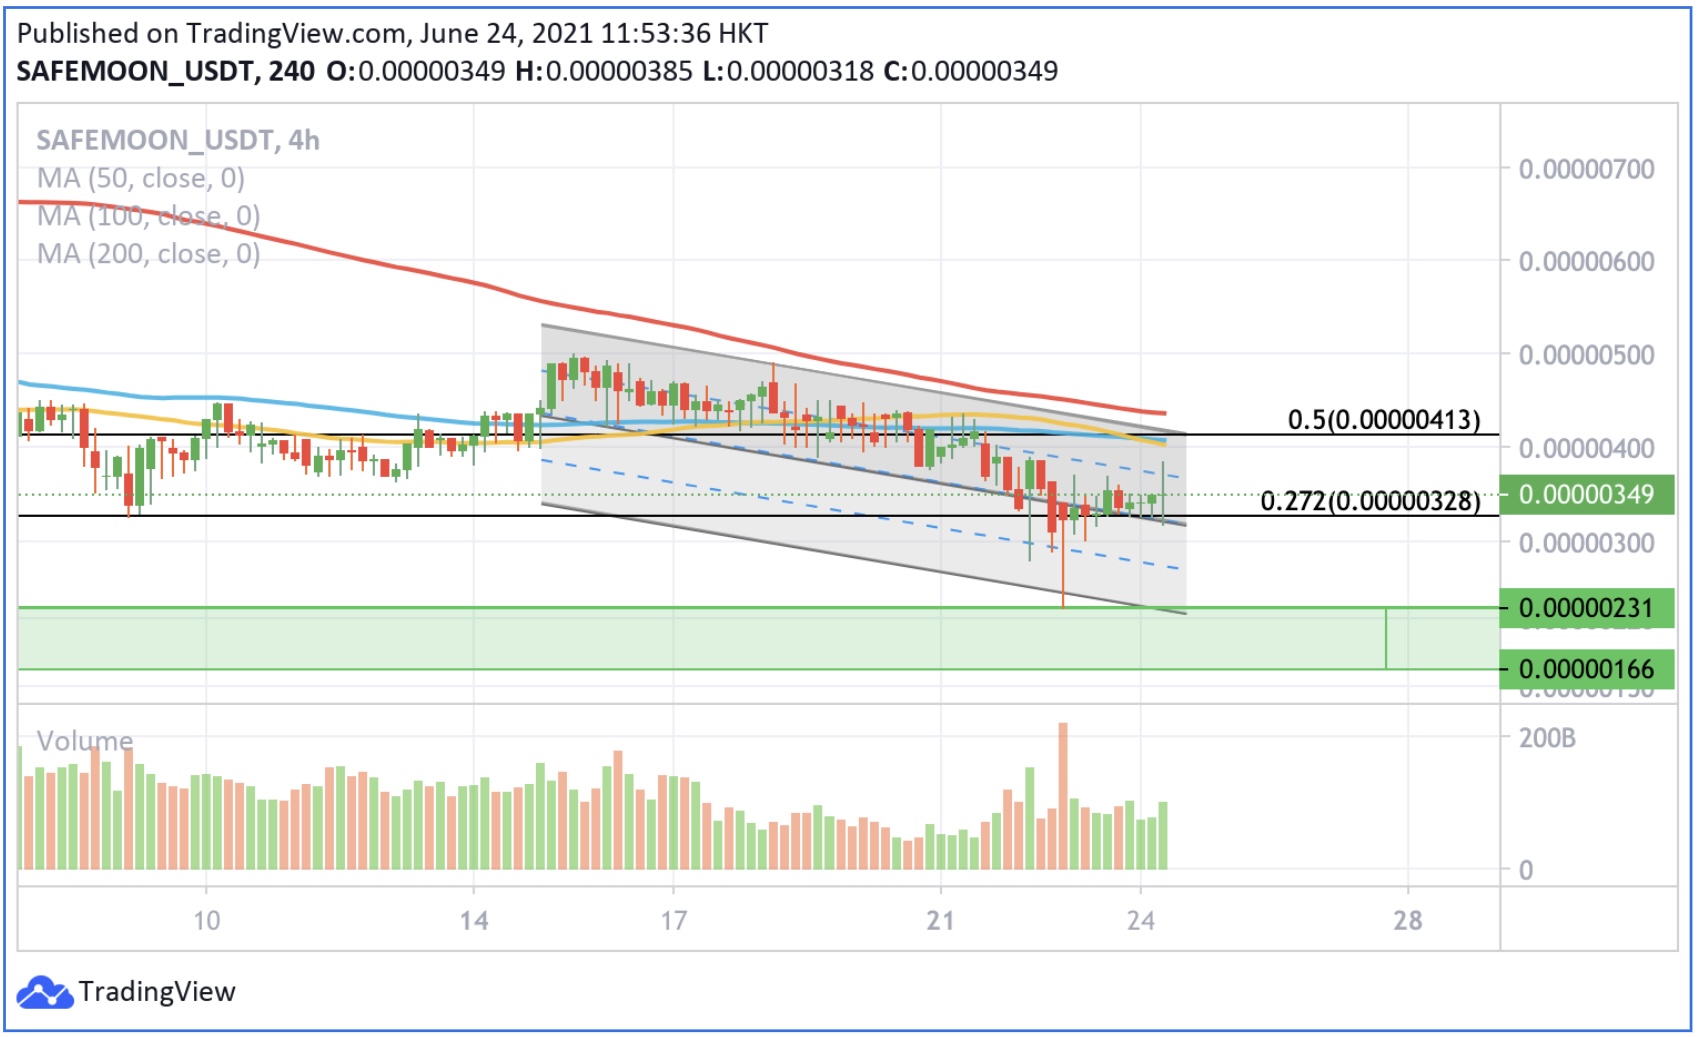
SAFEMOON/USDT 4-hour chart

Should selling pressure continue to increase in favor of the bears, SafeMoon price could free fall 35%, tagging the bottom trend line of the chart pattern, into the demand barrier at $0.00000231.

Investors should also pay attention to the 50% Fibonacci extension level at $0.00000413, which coincides with the 50 four-hour Simple Moving Average (SMA) and the 100four-hour SMA that acts as critical resistance if SafeMoon price manages to effect the reversal of fortune. 

Until SAFEMOON bulls are able to lift prices higher against the prolonged overpowering distribution of the sellers, SafeMoon price action is expected to head sideways with a slight downtrend. 


Note: All information on this page is subject to change. The use of this website constitutes acceptance of our user agreement. Please read our privacy policy and legal disclaimer. Opinions expressed at FXstreet.com are those of the individual authors and do not necessarily represent the opinion of FXstreet.com or its management. Risk Disclosure: Trading foreign exchange on margin carries a high level of risk, and may not be suitable for all investors. The high degree of leverage can work against you as well as for you. Before deciding to invest in foreign exchange you should carefully consider your investment objectives, level of experience, and risk appetite. The possibility exists that you could sustain a loss of some or all of your initial investment and therefore you should not invest money that you cannot afford to lose. You should be aware of all the risks associated with foreign exchange trading, and seek advice from an independent financial advisor if you have any doubts.

Join Telegram

Follow us on Telegram

Stay updated of all the news

Join Telegram

Recommended content


Follow us on Telegram

Stay updated of all the news

Join Telegram

Recommended Content

Editors’ Picks

Week Ahead: Altcoin plays for traders as Bitcoin crosses $42,000

Week Ahead: Altcoin plays for traders as Bitcoin crosses $42,000

Bitcoin price hit $40,000 over the weekend as investors anticipate a spot BTC ETF approval in January. Bitcoin trades around $42,000 and shows no signs of stopping. This article will focus on what to expect this week and the outlook for BTC and if the fourth cycle is any different.

More Bitcoin News

Crypto exchanges serving Indian residents to comply with Anti-Money Laundering guidelines: Indian Parliament

Crypto exchanges serving Indian residents to comply with Anti-Money Laundering guidelines: Indian Parliament

Crypto exchanges serving Indian residents to face action if not compliant with Anti-Money Laundering and Countering of Financial Terrorism guidelines.The process of registering offshore exchanges, Virtual Digital Asset service providers has been initiated.

More Cryptocurrencies News

Dogecoin breaks key $0.088 barrier ahead of tenth birthday, 87% DOGE holders at profit

Dogecoin breaks key $0.088 barrier ahead of tenth birthday, 87% DOGE holders at profit

As Dogecoin (DOGE) approaches its tenth anniversary on Wednesday, the Shiba-Inu-themed meme cryptocurrency has surpassed a crucial resistance level at $0.088076, reaching the highest level since mid-April.

More Dogecoin News

Bitcoin price could rally to $45,000 ahead of BTC halving event in April 2024

Bitcoin price could rally to $45,000 ahead of BTC halving event in April 2024

Bitcoin price crossed the $41,000 mark on Binance, in its ongoing uptrend. BTC price rally is likely driven by the anticipation of Spot Bitcoin ETF approval. There are more catalysts driving BTC price gains in the current cycle.

More Bitcoin News

Analyzing potential $30k corrections ahead of BTC ETF approval

Analyzing potential $30k corrections ahead of BTC ETF approval

Bitcoin has slowed down its 2023 bull rally as it approaches the $37,000 level. After three weeks of consolidating around this level, BTC shows no directional bias whatsoever. Some investors speculate this could be an upward-sloping accumulation that leads to a $40,000 rally.

Read full analysis

BTC

ETH

XRP