Safemoon Price Forecast: SAFEMOON to test the May 19 low with a 40% plunge
- SafeMoon price breakout from an inverse head-and-shoulders pattern failed today.
- Declining 50 four-hour simple moving average (SMA) putting pressure on SAFEMOON.
- A four-hour close above key tactical moving average may save digital asset from plummeting.

SafeMoon price failed to capitalize on the inverse head-and-shoulders pattern, keeping it below the crucial resistance elaborated by the 50 four-hour SMA and putting SAFEMOON on target to test the May 23 lows and possibly the May 19 lows.
SafeMoon price fades quickly with the broader crypto market
SafeMoon price remains in a larger downtrend that began on May 11. It has been interrupted with minor corrective bounces, but the recent inverse head-and-shoulders pattern presented a high probability opportunity for investors to begin pilot buys in the new, much-hyped digital token. Today that opportunity was voided when SAFEMOON traded below $0.00000438.
SAFEMOON outlook has shifted from positive to negative, with no credible support around the price at the time of writing ($0.00000410). The first definable support is the May 23 low at $0.00000285, followed closely by the May 19 low at $0.00000261, representing a 40% decline. The tight SafeMoon price range should command some buying interest from the ‘buy-the-dip’ group of investors.
A four-hour close below $0.00000261 would accelerate the SafeMoon price decline down to the April 21 low at $0.00000150, or potentially further, erasing almost 70% from the price at the time of writing.
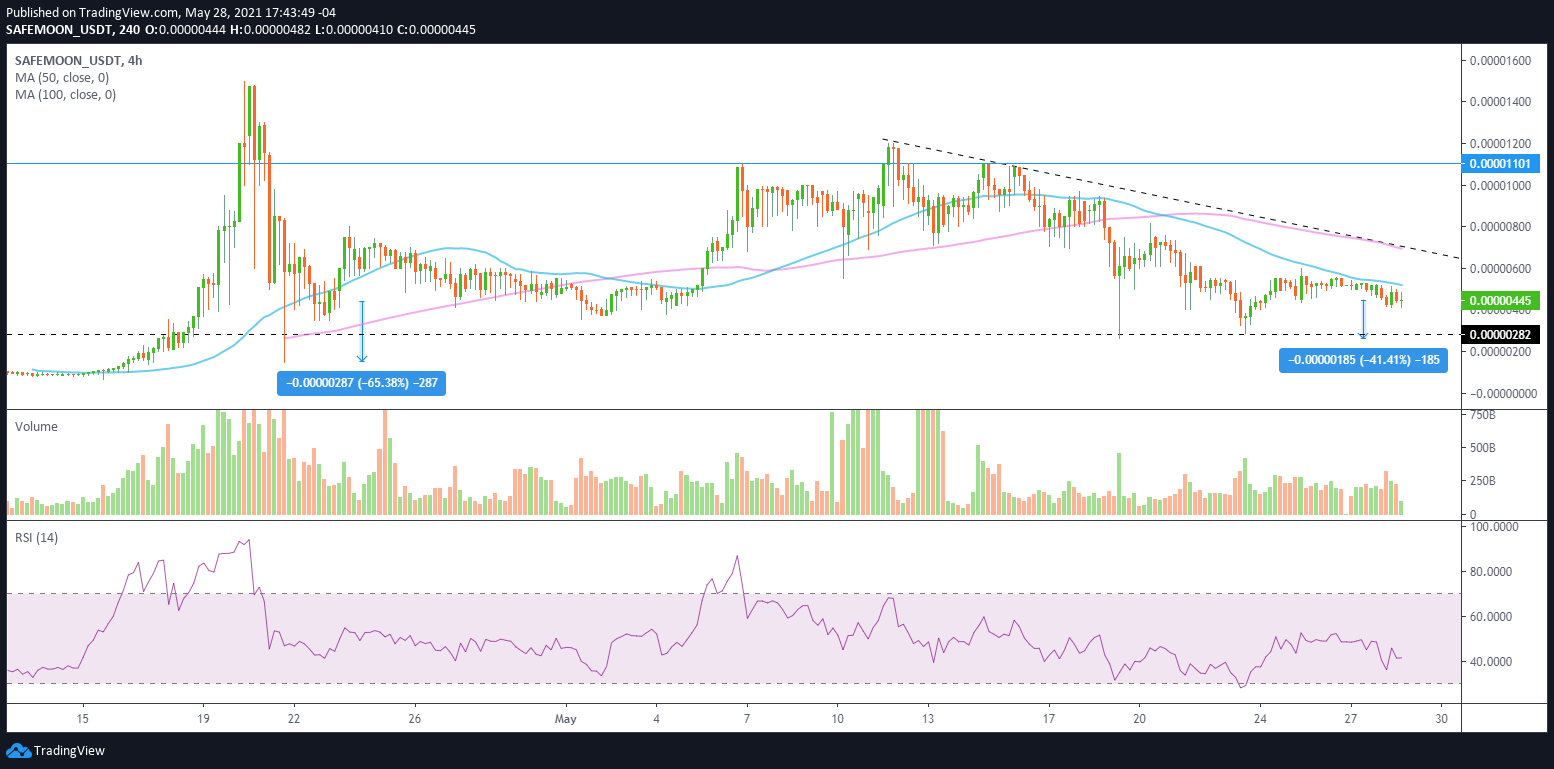
SAFEMOON/USD 4-hour chart
On the other hand, if SafeMoon price can sustain a consolidation around the low of the right shoulder of the inverse head-and-shoulders pattern at $0.00000438 and architect a clear price pattern, SAFEMOON could quickly overcome the resistance framed by the 50 four-hour SMA at $0.00000519.
A SafeMoon price close above the tactically important moving average on the four-hour chart leaves SAFEMOON free to test the confluence of the 200 four-hour SMA at $0.00000694 with the declining trend line from the May 11 high at $0.00000700.
Further gains would see heavy resistance at $0.00001100.
Author

Sheldon McIntyre, CMT
Independent Analyst
Sheldon has 24 years of investment experience holding various positions in companies based in the United States and Chile. His core competencies include BRIC and G-10 equity markets, swing and position trading and technical analysis.


