SafeMoon Price Forecast: SAFEMOON teeters on the edge of a 50% decline
- SafeMoon price continues to develop a descending triangle pattern with a measured move target of $0.00000133.
- Daily volume has slumped over the last ten days, suggesting indecision among SAFEMOON speculators.
- 10-day simple moving average (SMA) leaning on price, creating a very tight trading range over the last three days.

SafeMoon price action reflects the general lack of direction in the cryptocurrency complex, showing no commitment or energy. However, the descending triangle pattern proposes a clear roadmap for SAFEMOON, placing the risk to the downside and forecasting a potentially large loss if the bearish pattern resolves to the downside.
SafeMoon price drift creates havoc for the impatient investors
A descending triangle is classified as a bearish formation that usually emerges as a continuation pattern during a downtrend and indicates distribution. The horizontal trend line signifies demand that blocks the security from falling, while the lower reaction highs form the declining trend line as selling pressure increases.
Since May 21, SafeMoon price has shaped a descending triangle pattern with the horizontal trend line at $0.00000285 providing the trigger. On several occasions, SAFEMOON has glided below the horizontal trend line but has failed to register a daily close below, creating a challenge for eager bears.
If SafeMoon price records a daily close below $0.00000285, it will trigger the descending triangle pattern and officially shift the focus to the downside potential for SAFEMOON. The support levels that will intervene if selling pressure swells include the May 19 low of $0.00000261 and the June 22 low of $0.00000230, representing a 20% decline from the horizontal trend line.
Beyond the June 22 low, SafeMoon price is clear to plunge to the April 21 crash low of $0.00000150 before reaching the measured move target price of $0.00000133, representing a 50% decline from the horizontal trend line.
A collapse of 50% would wipe out most of the 2,140% gain accumulated during the explosive rally from April 15 to April 20 and secure an oversold reading on the SAFEMOON daily Relative Strength Index (RSI).
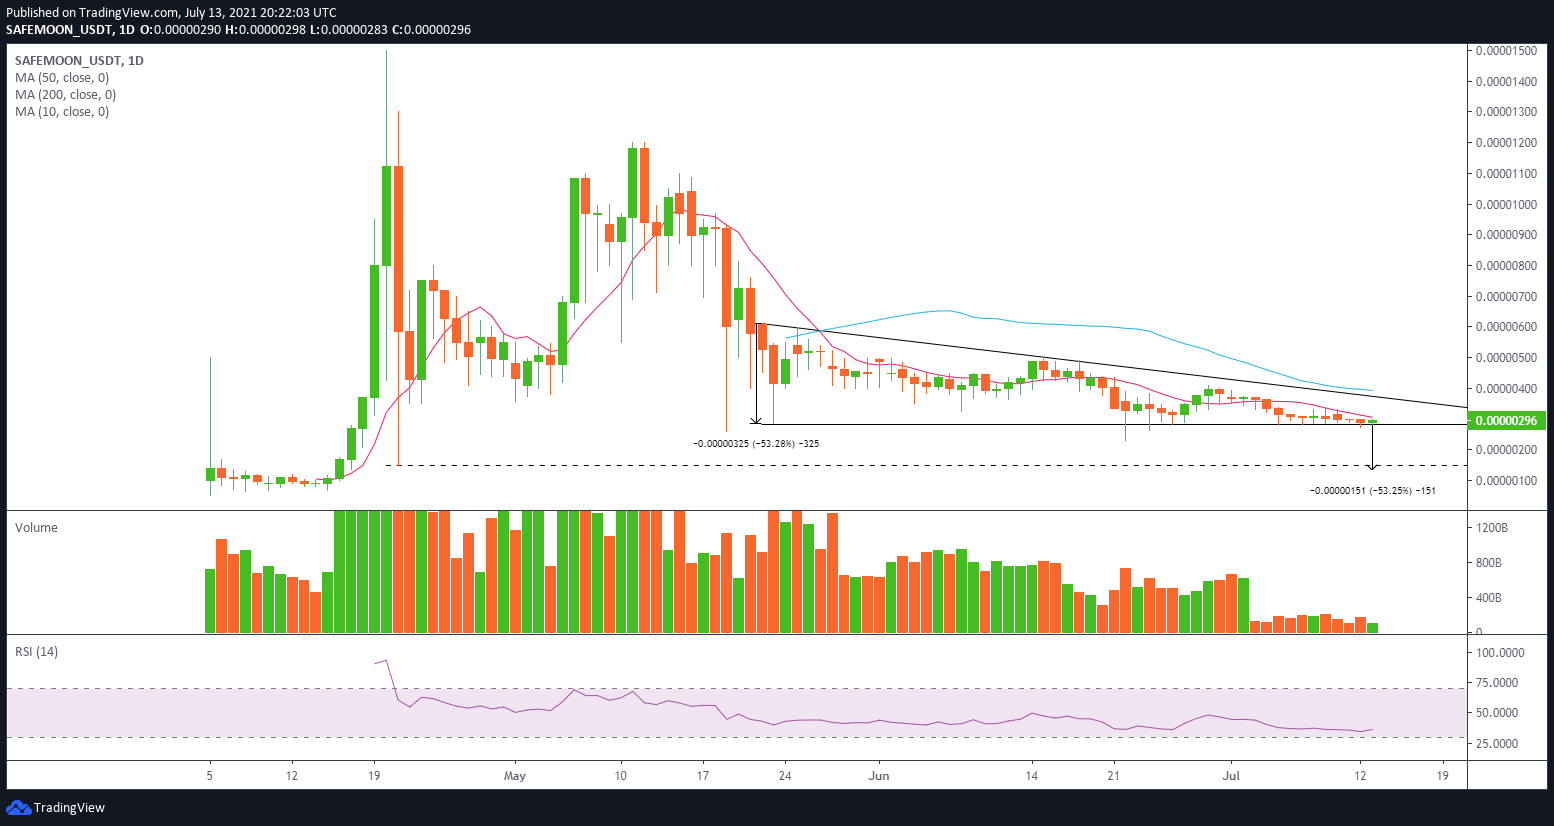
SAFEMOON/USD daily chart
Conversely, if SafeMoon price can complete a daily close above $0.00000338, it would alleviate the pressure generated by the declining 10-day SMA at $0.00000306 and free SAFEMOON to target the descending triangle’s upper trend line at $0.00000371, yielding a 30% gain from the current price.
With SafeMoon price currently trading at $0.00000287, SAFEMOON is hanging on the edge of a significant decline that will further dent the hopes of the novice cryptocurrency becoming a compelling investment alternative in the market. For now, investors need to be patient and let the pattern resolve, one way or the other.
Author

Sheldon McIntyre, CMT
Independent Analyst
Sheldon has 24 years of investment experience holding various positions in companies based in the United States and Chile. His core competencies include BRIC and G-10 equity markets, swing and position trading and technical analysis.


