SafeMoon Price Forecast: SAFEMOON bottom near completion, reveals 50% opportunity
- SafeMoon price is in the latter stage of forming a symmetrical triangle pattern, with a notable measured move of over 50%.
- SAFEMOON has experienced a substantial decline in volume over the last six trading days, suggesting selling exhaustion.
- Key moving averages serve as complicated obstacles if the pattern seeks to resolve to the upside.

SafeMoon price has been directed by the uncertainty and the resulting churn manifested in Bitcoin price over the last few weeks. As a result, SAFEMOON has presented several pattern alternatives since the May 19 low, with some failing to trigger and others unable to generate price traction post-breakout. However, the trend may change as the cryptocurrency works on a symmetrical pattern with the opportunity for a sizable profit outcome.
SafeMoon price bottom still in construction, investors need to forgive the inconvenience
A symmetrical triangle is generally regarded as a continuation pattern, but it can be a trend-ending formation. The developing SAFEMOON symmetrical triangle pattern may prove to be the beginning of a new trend higher, rather than an extension of the prevailing downtrend since May.
The presence of a larger symmetrical triangle pattern suggests SafeMoon price may be one step closer to marking the low of a 50-day bottoming process as the triangle’s apex is now in view. Critical to the bullish resolution of the pattern is for SAFEMOON to hold the pattern’s lower trend line, currently at $0.00000282, which tightly correlates with the May 23 low of $0.00000285.
The measured move of the pattern is 56%, placing the SAFEMOON target price at $0.00000540. The target is slightly beyond the 23.6% Fibonacci extension of the May-June correction at $0.00000526
To trigger the pattern, SafeMoon price needs to overcome the declining 50 four-hour simple moving average (SMA) at $0.00000335, an indicator that was challenging to overcome in late May and early June. Once the moving average has been defeated, SafeMoon price needs to trade above the triangle’s upper trend line to activate the pattern, currently at $0.00000348.
The SAFEMOON breakout will be tested immediately by resistance framed by the 200 four-hour SMA, currently at $0.00000378. Beyond the moving average, SafeMoon price does not meet credible resistance until $0.00000500, a level of highs going back to late May and mid-June. A rally to that level would equate to a 45% gain from the current position of the triangle’s upper trend line.
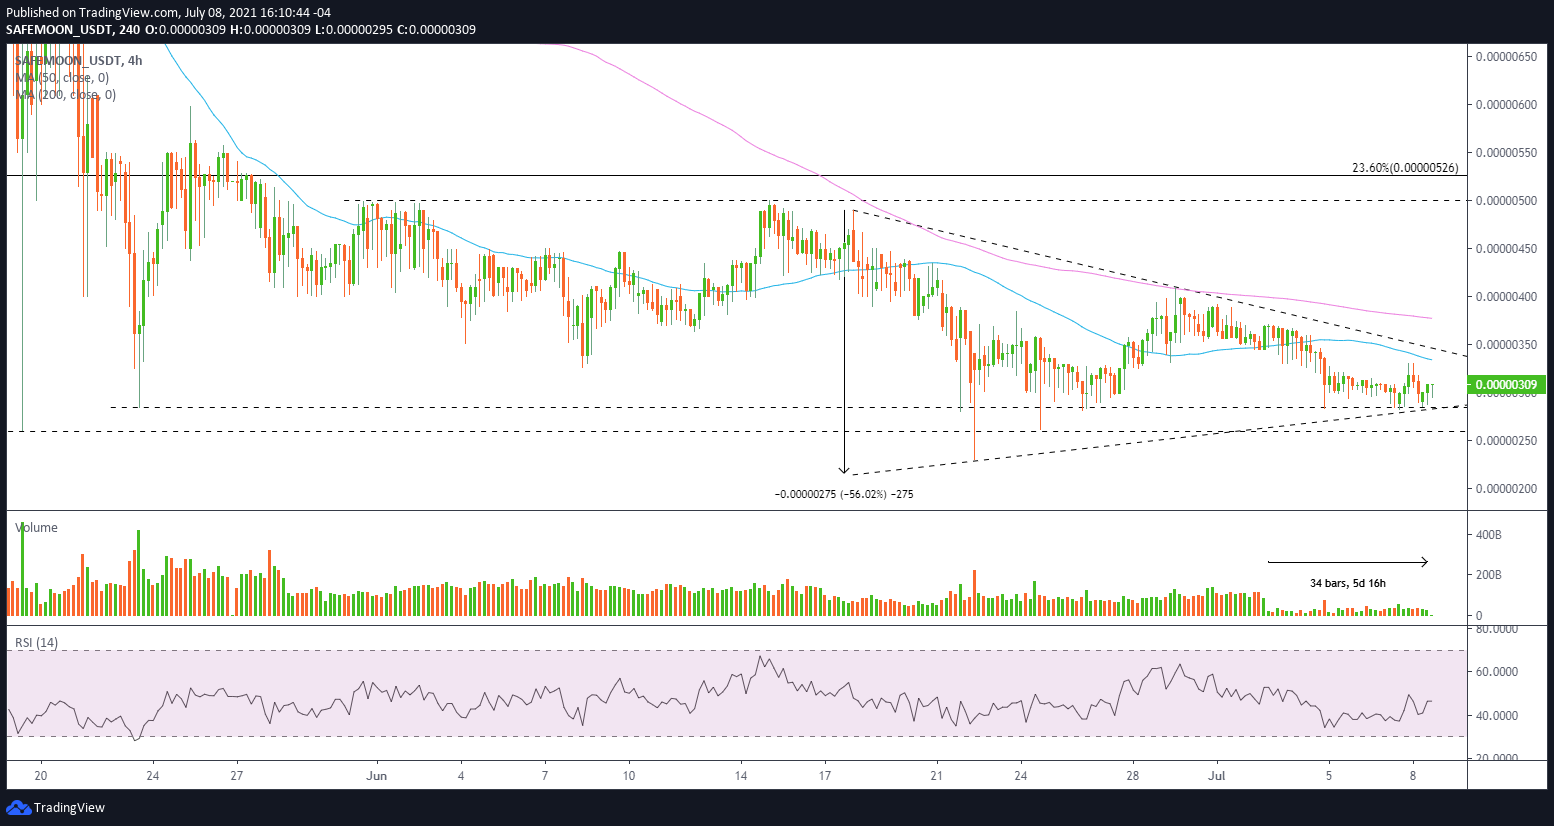
SAFEMOON/USDT 4-hour chart
If SafeMoon price fails to hold $0.00000282 on a four-hour closing basis, SAFEMOON will quickly drop to the May 19 low of $0.00000261 and possibly to the June 22 low of $0.00000230, representing an approximate loss of 20% from $0.00000282.
As with all bottoming processes, especially in a challenging cryptocurrency market, SAFEMOON still has a lot to prove before it can claim the measured move of 56%. Nevertheless, the duration of the pattern, the visible selling exhaustion in the volume profile and the presence of considerable support near the current price relay a mild optimism about the opportunity for SafeMoon price moving forward.
Author

Sheldon McIntyre, CMT
Independent Analyst
Sheldon has 24 years of investment experience holding various positions in companies based in the United States and Chile. His core competencies include BRIC and G-10 equity markets, swing and position trading and technical analysis.


