SafeMoon Price Forecast: SAFEMOON appears decisive, readies for a 20% rally
- SafeMoon price may be shaping a cup completion cheat pattern on the two-hour chart.
- 200 two-hour simple moving average (SMA) emerging as an obstacle.
- SAFEMOON reacts to a bearish momentum divergence on the two-hour Relative Strength Index (RSI).

SafeMoon price has been engaged in a bottoming process that has twisted investors with various buy signals that eventually failed or never triggered. Currently, SAFEMOON appears to be framing a new bottoming pattern that could offer a timely opportunity to capture a 20% return.
SafeMoon price proves that it can get up and fight another day
SafeMoon price rallied almost 80% from the June 22 low of $0.00000230, surpassing the 50 two-hour SMA and logging the first overbought condition on the two-hour RSI since early May, demonstrating an impulsive bid and decisiveness for the rookie cryptocurrency. The SAFEMOON rally has culminated with a vigorous test of the 200 two-hour SMA and a negative momentum divergence on the RSI.
The emerging SAFEMOON corrective process around the 200 two-hour SMA at $0.00000382 is supported by the 50 two-hour SMA at $0.00000352. SafeMoon price has removed some of the overbought condition as it develops the handle of a cup completion cheat pattern with a trigger price of $0.00000410.
Cup completion cheat patterns generally develop in the bottom half of a cup formation and provide an early but timely opportunity to participate in the momentum accompanying the base’s right side. The SAFEMOON pattern is currently developing around the middle of the base.
It is anticipated that SafeMoon price will continue to consolidate the recent 80% gain. Still, it may dip lower than the 50 two-hour SMA, thereby pushing the RSI down near an oversold reading. It would be a healthy and constructive evolution that will instill the price energy to overcome the trigger price of $0.00000410 and carry SAFEMOON to the target of $0.00000500, representing a 20% gain.
If the momentum is strong, SafeMoon price will likely test the 50-day SMA at $0.00000507.
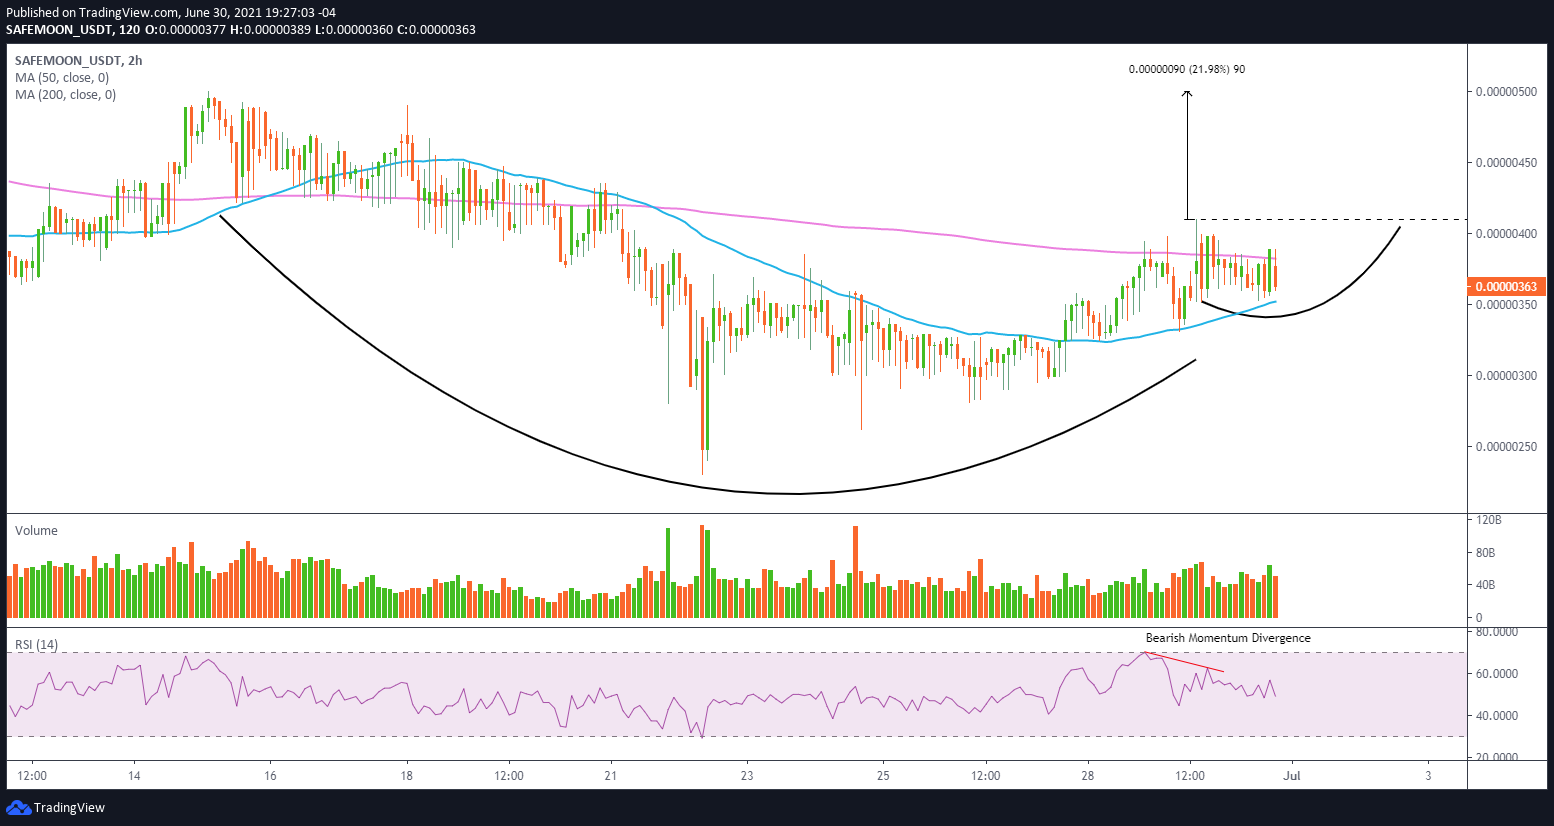
SAFEMOON/USD 2-hour chart
A drop below $0.00000331 will defeat the bullish SAFEMOON pattern and place SafeMoon price in a vulnerable situation. A resumption of heavy selling pressure in the cryptocurrency complex could knock the token back to the June 22 low of $0.00000230.
Author

Sheldon McIntyre, CMT
Independent Analyst
Sheldon has 24 years of investment experience holding various positions in companies based in the United States and Chile. His core competencies include BRIC and G-10 equity markets, swing and position trading and technical analysis.


