SafeMoon price consolidates, but 35% ascent awaits
- SafeMoon price could continue to retrace following last week’s tremendous rally of over 200%.
- The token has printed a bullish continuation pattern, suggesting a 35% climb.
- If SAFEMOON manages to overcome the topside trend line of the technical pattern that acts as resistance, this will put the optimistic target on the radar.

SafeMoon price appears to be consolidating following its 230% rise in the past week, reaching a swing high at $0.00000700 on October 29. SAFEMOON could continue to move sideways as the bulls catch their breath after the explosive uptrend.
SafeMoon price shows optimism following consolidation
SafeMoon price has formed a falling wedge pattern on the 4-hour chart. SAFEMOON is likely to move sideways between clearly defined technical levels within the chart pattern until the bulls overcome the upper boundary of the technical pattern, acting as resistance against the buyers.
The falling wedge pattern suggests a bullish outlook for SafeMoon price, with a target of a 35% climb. Only if the buyers overcome the topside trend line of the chart pattern at $0.00000497 will SAFEMOON reach the optimistic target.
However, investors should note that the token is nowhere near the aforementioned resistance line. Therefore, SafeMoon price could continue moving sideways.
Until the buyers stay committed to pushing SafeMoon price higher, the token would face resistance at the October 28 high at $0.00000430.
The next obstacle for SAFEMOON is at the 50 four-hour Simple Moving Average (SMA) at $0.00000461. Additional hurdles may appear at the November 2 and November 1 high, at $0.00000518 and $0.00000550, respectively, before SafeMoon price reaches its bullish target at $0.00000573, coinciding with the 78.6% Fibonacci retracement level. This would be a 35% ascent.
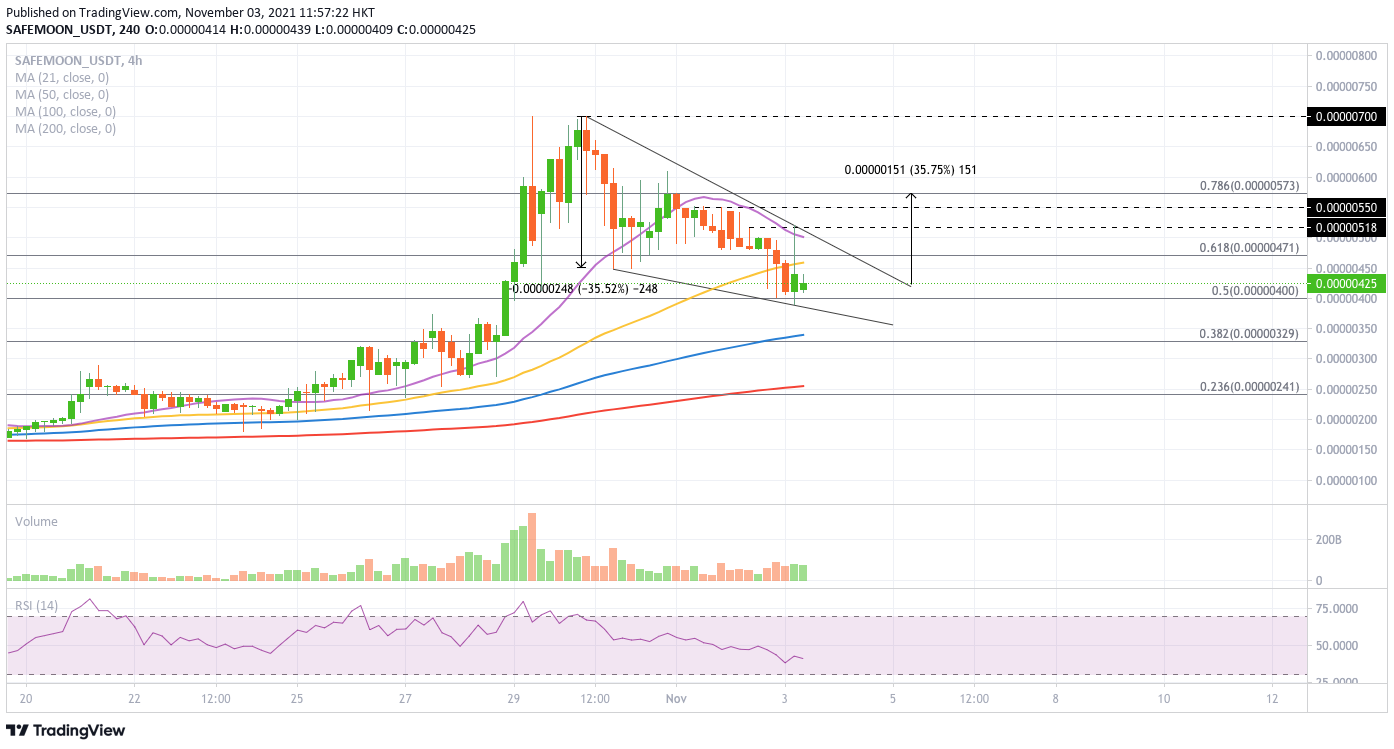
SAFEMOON/USDT 4-hour chart
However, if SafeMoon price is overpowered by resistance and sees a rise in selling pressure, it would discover immediate support at the 50% Fibonacci retracement level at $0.00000400. The following line of defense will emerge at the lower boundary of the falling wedge pattern at $0.00000382, then at the 100 four-hour SMA at $0.00000342 before dropping lower to tag the 38.2% Fibonacci retracement level at $0.00000329.
Although lower targets are not expected, a massive spike in sell orders could push SafeMoon price toward the 200 four-hour SMA at $0.00000255, erasing most of last week’s gains.
Author

Sarah Tran
Independent Analyst
Sarah has closely followed the growth of blockchain technology and its adoption since 2016.


