SafeMoon attempts breakout that could launch SFM more than 15%
- SafeMoon price develops a bullish reversal pattern on its 4-hour Ichimoku chart.
- Oscillators give mixed signals regarding the probability of a sustained rally.
- Critical resistance levels may limit the scope and breadth of any bullish momentum.

SafeMoon price has been under intense selling pressure over the past nine trading days. After falling more than 26%, it finally found support against a prior traded low in the $0.0014 value area. Since then, however, some bullish momentum has returned, and bulls now look for an opportunity to take control.
SafeMoon price action ready to spike and initiate a short-squeeze
SafeMoon price has developed one of most the ideal bullish reversal patterns in technical analysis: the inverse head-and-shoulders pattern. Like any head-and-shoulders pattern, it is not complete nor confirmed until the neckline is broken, which would only occur if SFM breaks above $0.00160.
However, head-and-shoulder patterns have a notoriously high pullback/throwback rate. This means that after SafeMoon price breaks out above the neckline, a pullback to the neckline is highly probable. This behavior is a ‘re-test’ condition that many conservative traders wait to observe before entering a long position.
If the re-test holds the neckline as support, then buyers on the sidelines often enter their new long positions. Conversely, if the neckline fails to hold as support and price instead moves back inside the inverse head-and-shoulders pattern, buyers stay out, and aggressive short-sellers usually enter due to trapped buyers.
The probability of a pullback to the neckline on any breakout is exceptionally high. As a result, SafeMoon price will hit two resistance levels above the neckline that may generate that pullback. The first resistance level is the bottom of the Ichimoku Cloud (Senkou Span A) at $0.00167. The second and most powerful is the top of the Ichimoku Cloud (Senkou Span B) at $0.00173.
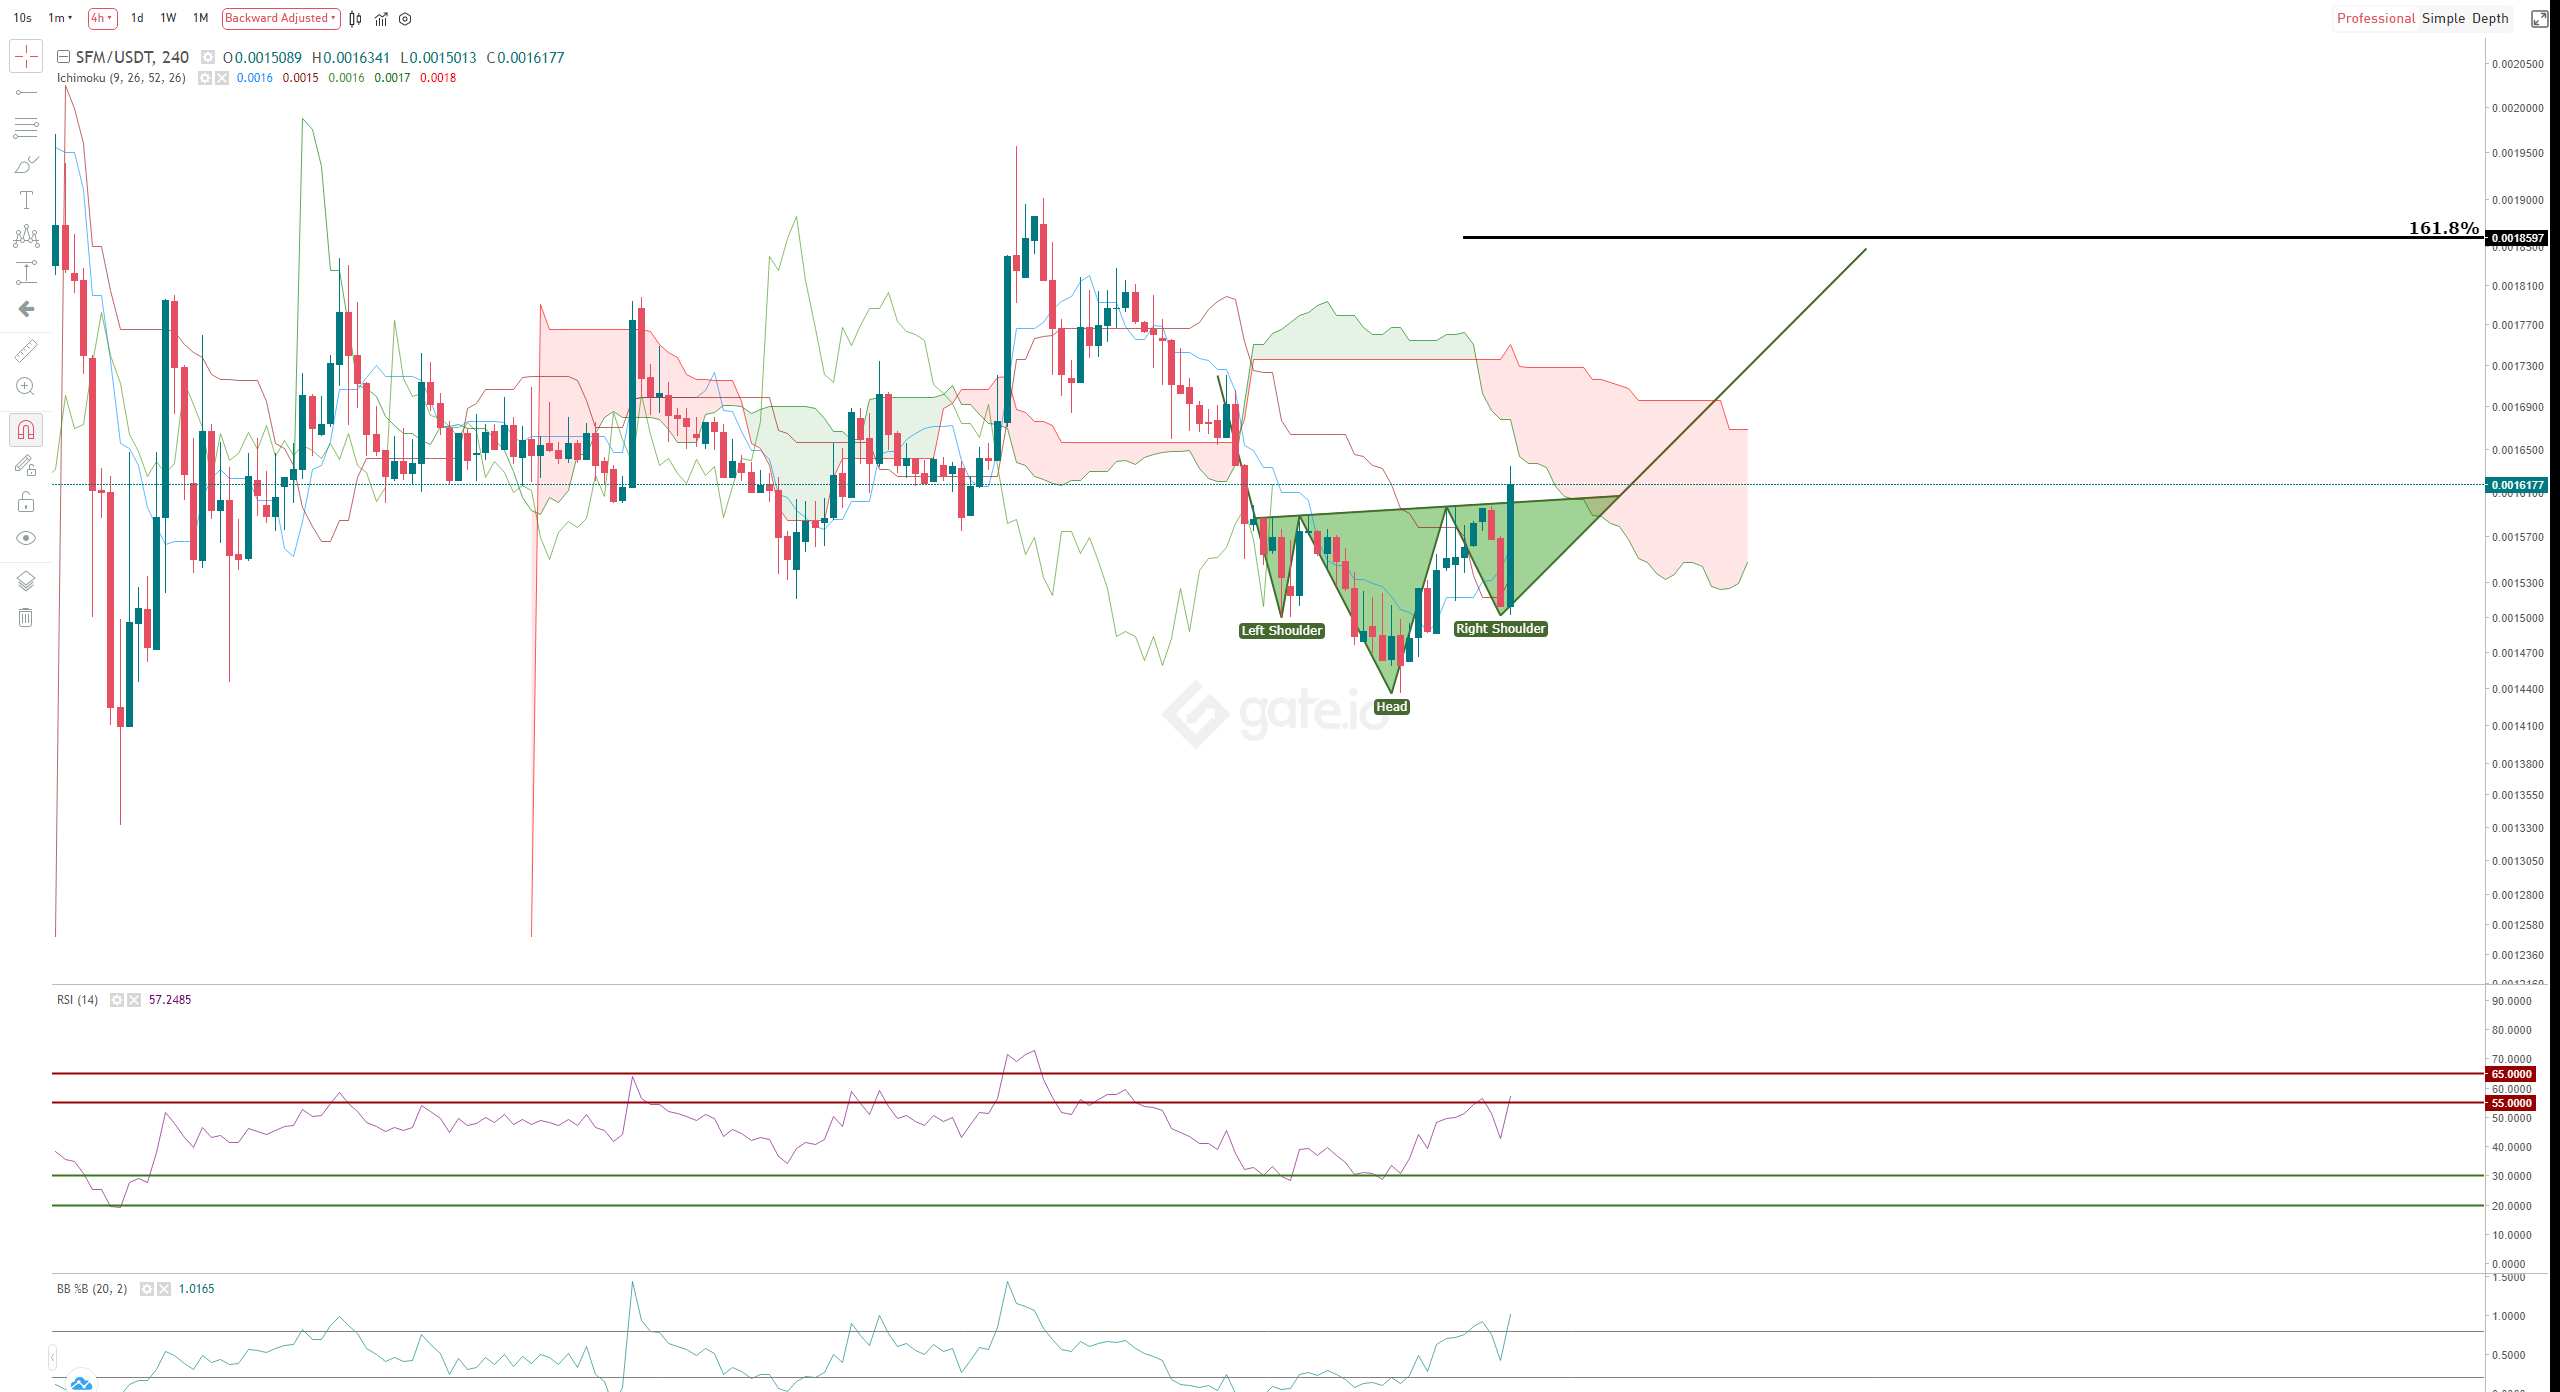
SFM/USDT 4-hour Ichimoku Kinko Hyo Chart
If bulls wish to regain momentum and control of SafeMoon price, the neckline must hold as support if any breakout re-test does occur.
A close below $0.00150 would invalidate any near-term bullish outlook and likely resume the prior selling pressure.
Author

Jonathan Morgan
Independent Analyst
Jonathan has been working as an Independent future, forex, and cryptocurrency trader and analyst for 8 years. He also has been writing for the past 5 years.


