Ripple's XRP technical analysis: XRP/USD triangular structure confinements capping further bullish potential for now
- Ripple's XRP price is trading in the red, nursing losses of around 1.9% in the second half of Tuesday.
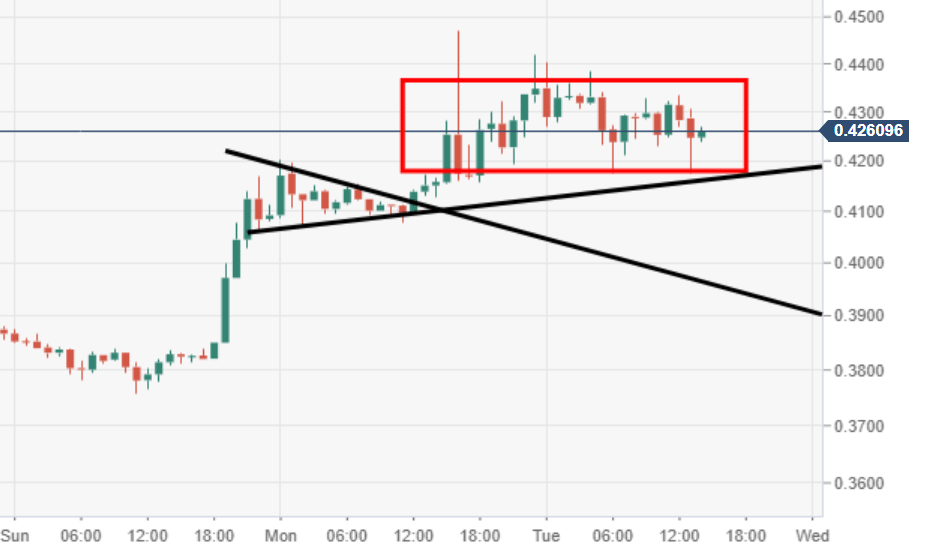
- XRP/USD moving within the confinements of a narrowing triangular structure, as the upper acting trend line holds firm for now.
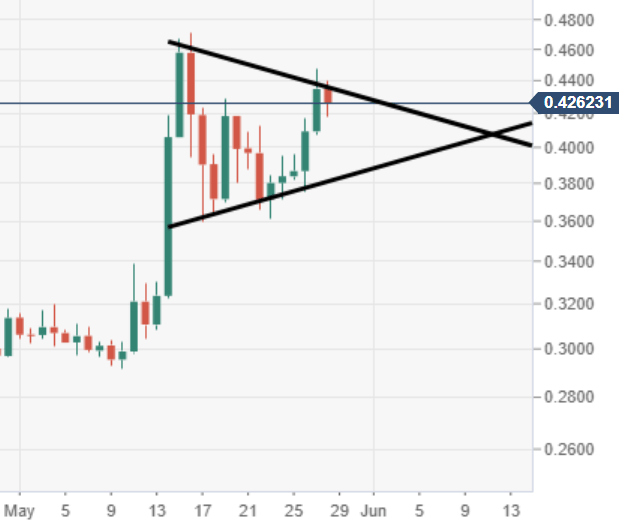
- The next major barrier is seen just ahead at $0.5000, should the bulls breakdown $0.4600-0.4800 region.

Spot rate: 0.4261
Relative change: -1.90%
High: 0.4403
Low: 0.4175
XRP/USD 60-minute chart
- Price action is consolidating as seen via the 60-minute chart view, after a breakout from a near-term bullish pennant pattern.
XRP/USD daily chart
- Bulls are taking a break for now consolidating, following a strong push higher over the past five sessions.
Author

Ken Chigbo
Independent Analyst
Ken has over 8 years exposure to the financial markets. He started his career as an analyst, covering a variety of asset classes; forex, fixed income, commodities and equities.
More from Ken Chigbo


