|

Ripple's XRP technical analysis: XRP/USD remains within horizontal range channel structure

  • Ripple's XRP in the second half of Tuesday's session is trading in the red, down some 2.00%. 
  • XRP/USD price action continues to move within a horizontal channel structure via the daily. 
  • The psychological $0.4000 is once again causing some problems, acting as a barrier.   

Spot rate:                 0.3952

Relative change:      -2.00%

High:                        0.4081

Low:                         0.3922

XRP/USD

Overview
Today last price0.3949
Today Daily Change-0.0077
Today Daily Change %-1.91
Today daily open0.4026
 
Trends
Daily SMA200.4236
Daily SMA500.4165
Daily SMA1000.3743
Daily SMA2000.3501
Levels
Previous Daily High0.4047
Previous Daily Low0.3934
Previous Weekly High0.4277
Previous Weekly Low0.3741
Previous Monthly High0.5074
Previous Monthly Low0.3704
Daily Fibonacci 38.2%0.4004
Daily Fibonacci 61.8%0.3977
Daily Pivot Point S10.3958
Daily Pivot Point S20.389
Daily Pivot Point S30.3845
Daily Pivot Point R10.407
Daily Pivot Point R20.4115
Daily Pivot Point R30.4183

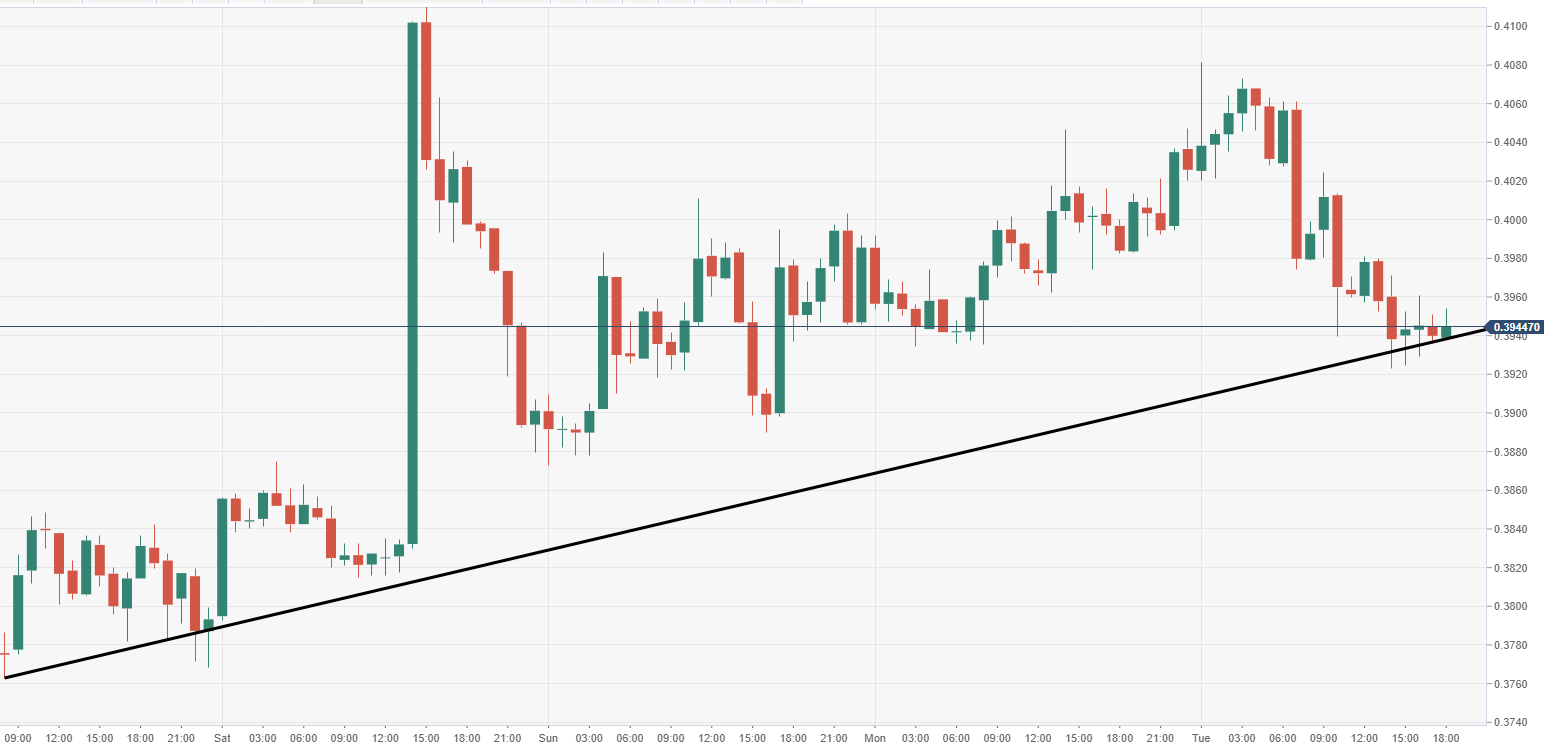
XRP/USD 60-minute chart

  • 60-minute chart view is tracking very closely to an ascending trend line of support. 
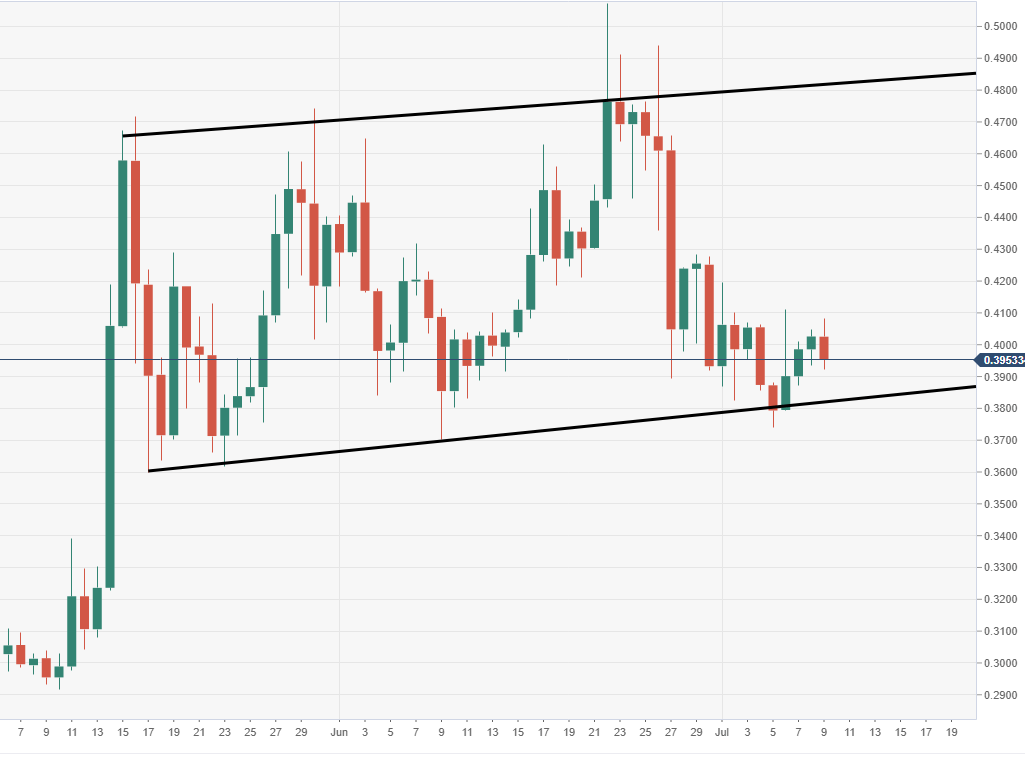
XRP/USD daily chart

  • Price action is very much ranging via the daily chart view, a lack of committed direction for now.

Author

Ken Chigbo

Ken Chigbo

Independent Analyst

Ken has over 8 years exposure to the financial markets. He started his career as an analyst, covering a variety of asset classes; forex, fixed income, commodities and equities.

More from Ken Chigbo
Share:

Editor's Picks

Ripple extends losses as derivatives interest cools

Ripple (XRP) extends its bearish roll near $1.12 support on Friday, reflecting intense headwinds in the broader crypto market largely attributable to macroeconomic pressure.

Crypto Today: Bitcoin, Ethereum, XRP weaken further as capital outflows persist

Macroeconomic headwinds continue to weigh heavily on the cryptocurrency market on Friday, prompting major assets like Bitcoin (BTC) to pare earlier gains and extend losses after June’s brief relief rally.

Bitcoin Weekly Forecast: Recovery hopes fade after the Fed spoils the party

Bitcoin is set to end the week in the red, trading near the 200-Week Simple Moving Average at around $62,300 on Friday. Institutional selling persists, capping BTC’s recovery as spot Exchange Traded Funds point to a sixth consecutive week of outflows.

Sui risks a deeper bearish leg despite on-chain resilience

Sui is down 2% on Friday, extending its decline toward the recent support leg formed at $0.6618. The Total Value Locked in the Sui ecosystem has stabilized around 600 million SUI tokens, reflecting resilient user demand.

Bitcoin: Recovery hopes fade after the Fed spoils the party
Bitcoin (BTC) is set to end the week in the red, trading near the 200-Week Simple Moving Average (SMA) at around $62,300 on Friday. Institutional selling persists, capping BTC’s recovery as spot Exchange Traded Funds (ETFs) point to a sixth consecutive week of outflows.