|

Ripple's XRP technical analysis: XRP/USD bullish flag subject to a breakout

  • Ripple's XRP price is trading marginally in the red, down just some 0.60% in the second half of the session. 
  • XRP/USD via the daily chart view sees a bullish technical set up, pennant structure subject to a breakout. 
  • Heavy near-term supply remains running from $0.4000 up to $0.4100, capping upside potential at present.  

Spot rate:                 0.4007

Relative change:      -0.65%

High:                        0.4102

Low:                         0.3964

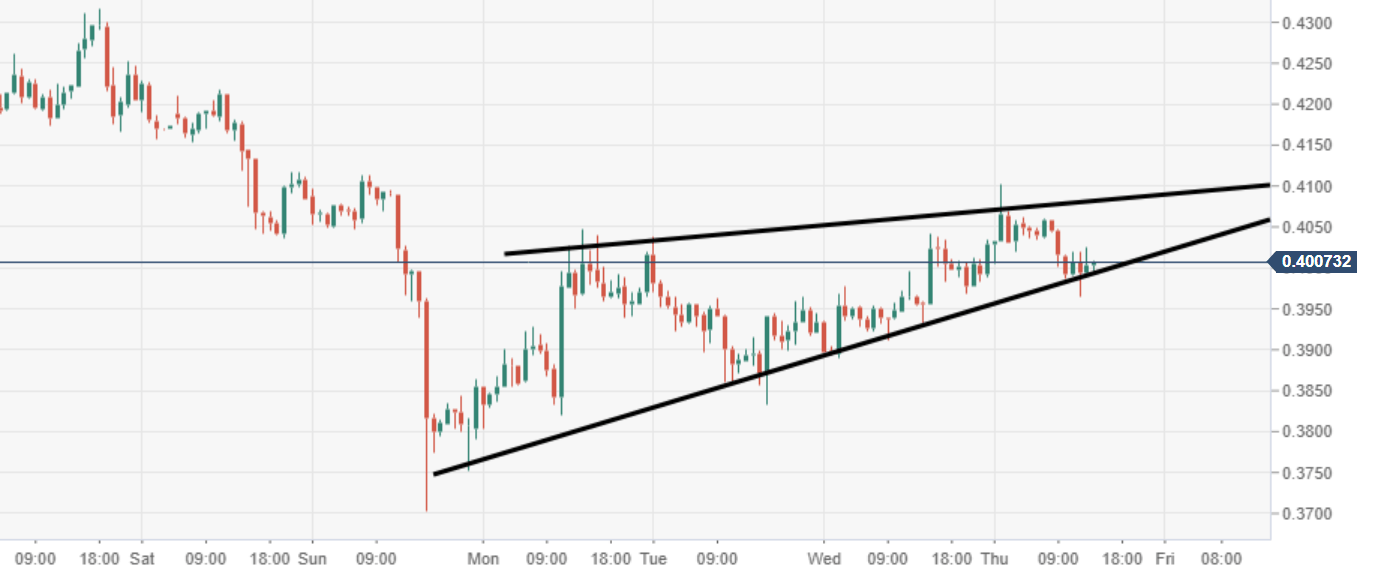
XRP/USD 60-minute chart

  • Price action via the 60-minute chart view is narrowing within a rising wedge pattern formation. 

XRP/USD daily chart

  • XRP/USD daily price action is moving within a bullish pennant pattern formation, something which is seen with some of its peers also.  

Author

Ken Chigbo

Ken Chigbo

Independent Analyst

Ken has over 8 years exposure to the financial markets. He started his career as an analyst, covering a variety of asset classes; forex, fixed income, commodities and equities.

More from Ken Chigbo
Share:

Editor's Picks

Ripple stabilizes as support holds amid steady ETF inflows

Ripple pares losses and trades around $1.05 at the time of writing on Monday. The cross-border remittance token is attempting a recovery after last week’s sell-off, which intensified as the US and Iran exchanged fire.

Crypto Today: Bitcoin and Ethereum edge higher, XRP pares losses as US and Iran agree to resume talks

Bitcoin is showing renewed signs of recovery, approaching the $60,000 mark at the time of writing on Monday. Among altcoins, Ethereum is positioned for a potential breakout above $1,600, while Ripple continues to face bearish pressure, holding just above the key $1.00 psychological support.

Bitcoin four-year cycle: BTC risks 75% drawdown with four months of bear market still ahead

Bitcoin price continues to trend downward below the $60,000 support zone after losing over 50% of its value since the $126,199 high in October. Bitcoin’s four-year cycle, measured from cycle tops to bottoms, suggests that four months of a bear market are still ahead.

Bitcoin Price Forecast: Mild recovery as US and Iran agree to halt attacks, resume talks

Bitcoin recovers slightly on Monday, trading above $60,000 after closing below the 200-week SMA the previous week. Market sentiment turned cautiously positive after the US and Iran agreed to halt attacks and renew peace talks.

Bitcoin: BTC hits 20-month low, will the pain continue?

Bitcoin has remained under pressure this past week, losing over 5% as traders assess mixed signals from different parties involved in the Middle East conflict.