Ripple's XRP Technical Analysis: XRP/USD bears are back biting hard
- Ripple's XRP has taken a hit on Thursday, nursing steep losses of some 3%.
- XRP/USD bears forced a breakout to the downside from a supporting ascending trend line, opening the door to larger selling.

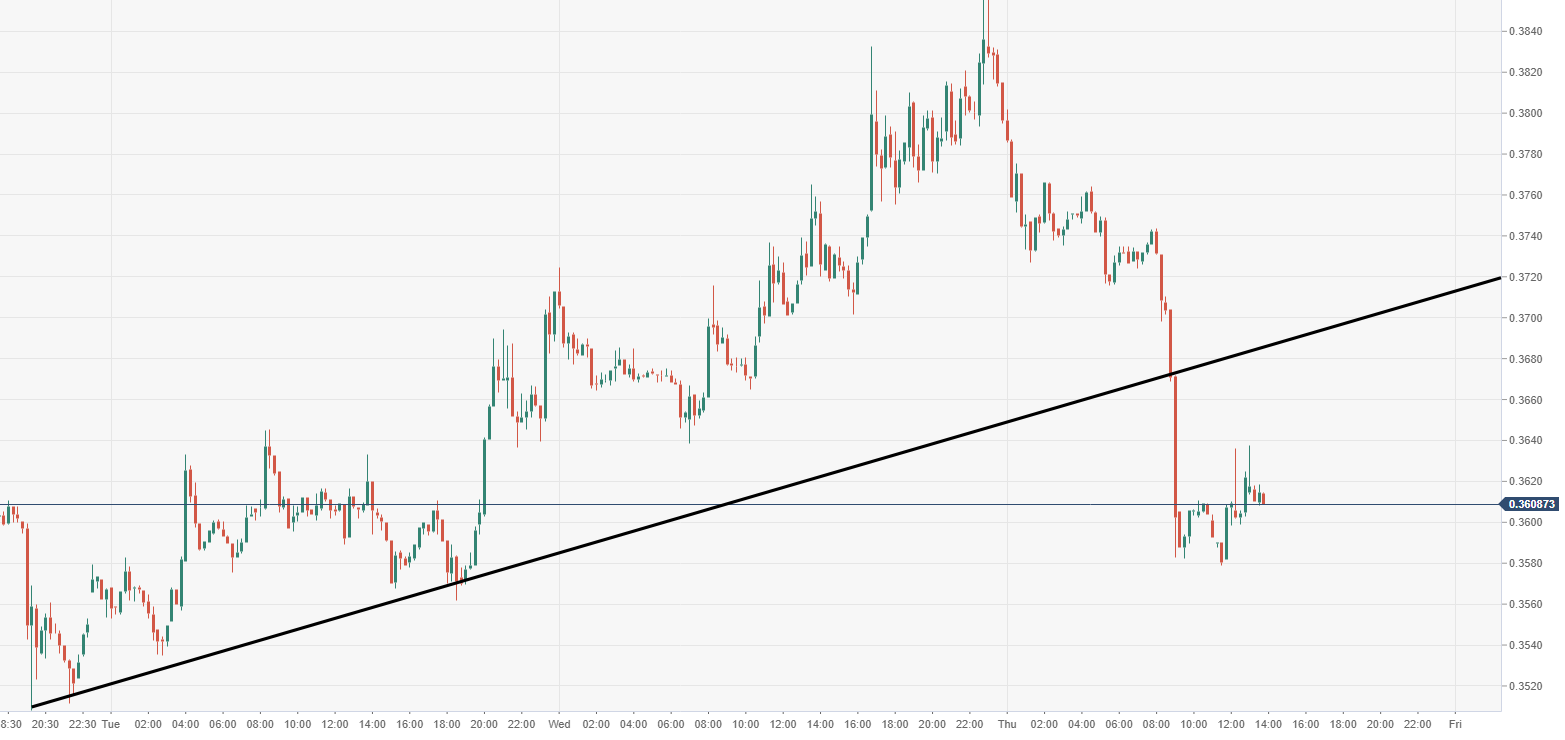
XRP/USD 15-minute chart
- Bears force the price to smash out to the downside from a near-term supporting ascending trend line.
Spot rate: 0.3608
Relative change: -3.25%
High: 0.3857
Low: 0.3608
Trend: Bearish
Support 1: 0.3670, daily pivot point support.
Support 2: 0.3545, daily pivot point support.
Support 3: 0.3451, daily pivot point support.
Resistance 1: 0.3890, daily pivot point resistance.
Resistance 2: 0.3983, daily pivot point resistance.
Resistance 3: 0.4109, daily pivot point resistance.
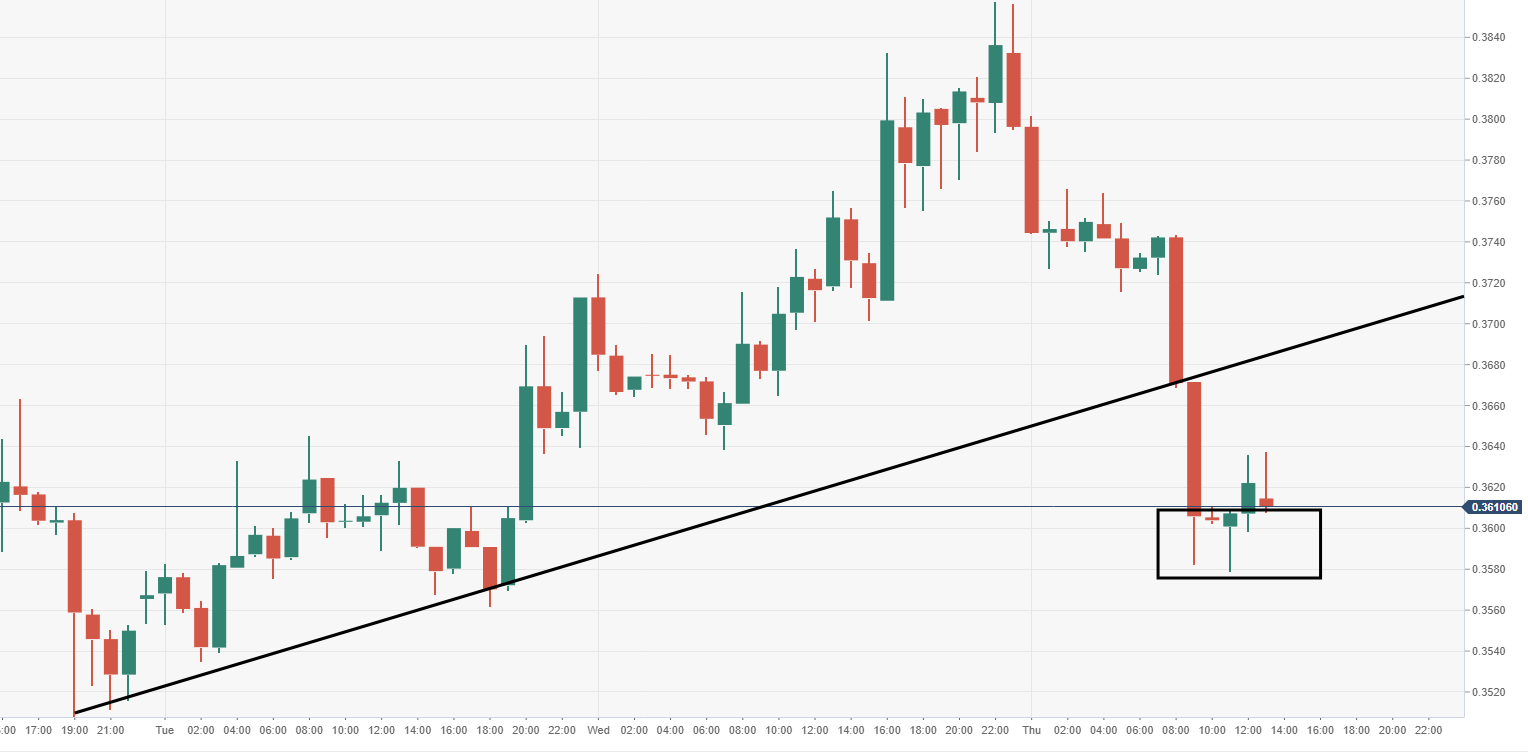
XRP/USD 60-minute chart
- Price action broke a vital near-term supporting trend line, it has caught a near-term bid for now, possible breakout and retest.
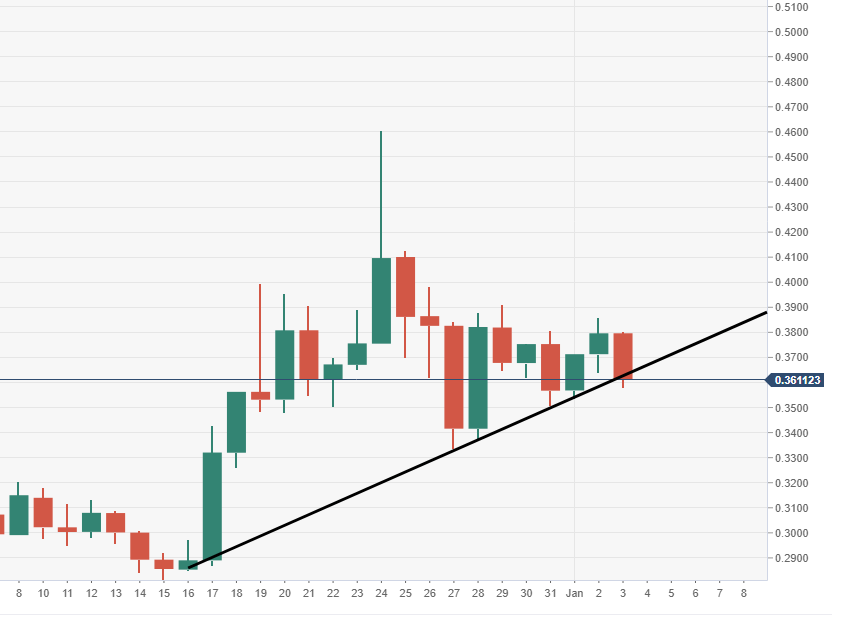
XRP/USD daily chart
- XRP/USD over the daily time frame is testing another critical descending trend line to the downside.
Author

Ken Chigbo
Independent Analyst
Ken has over 8 years exposure to the financial markets. He started his career as an analyst, covering a variety of asset classes; forex, fixed income, commodities and equities.


