Ripple's XRP Technical Analysis: XRP/USD bearish technical pattern structures eyed
- Ripple's XRP price on Monday was seen trading up with minor gains of some 0.40% in the second half of the session.
- XRP/USD vulnerabilities still point to the downside, given technical price pattern structures.

XRP/USD 15-minute chart
- Price action has formed a bearish flag pattern, subject to an extended break lower.
Spot rate: 0.3208
Relative change: +0.40%
High: 0.3247
Low: 0.3187
Trend: Bullish/Neutral
Support 1: 0.3109, daily pivot point support.
Support 2: 0.3020, daily pivot point support.
Support 3: 0.2898, daily pivot point support.
Resistance 1: 0.3319, daily pivot point resistance.
Resistance 2: 0.3441, daily pivot point resistance.
Resistance 3: 0.3530, daily pivot point resistance.
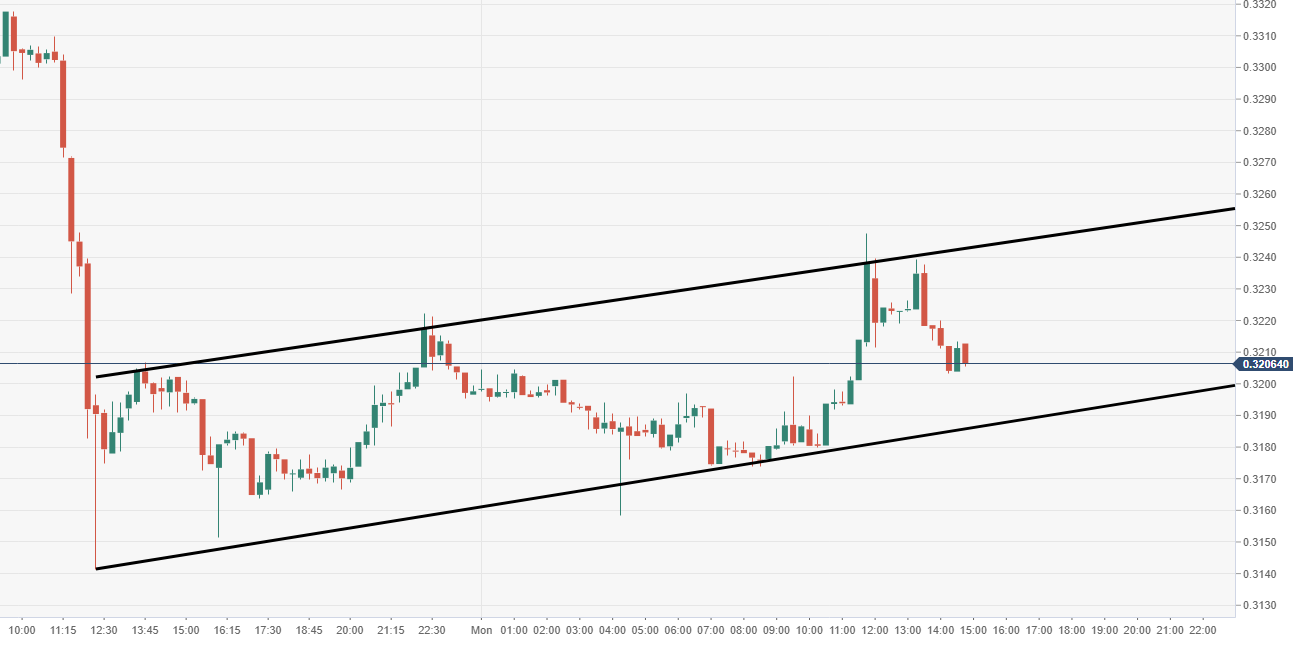
XRP/USD 60-minute chart
- . Price action moving within this ascending channel, making up possible bearish flag formation.
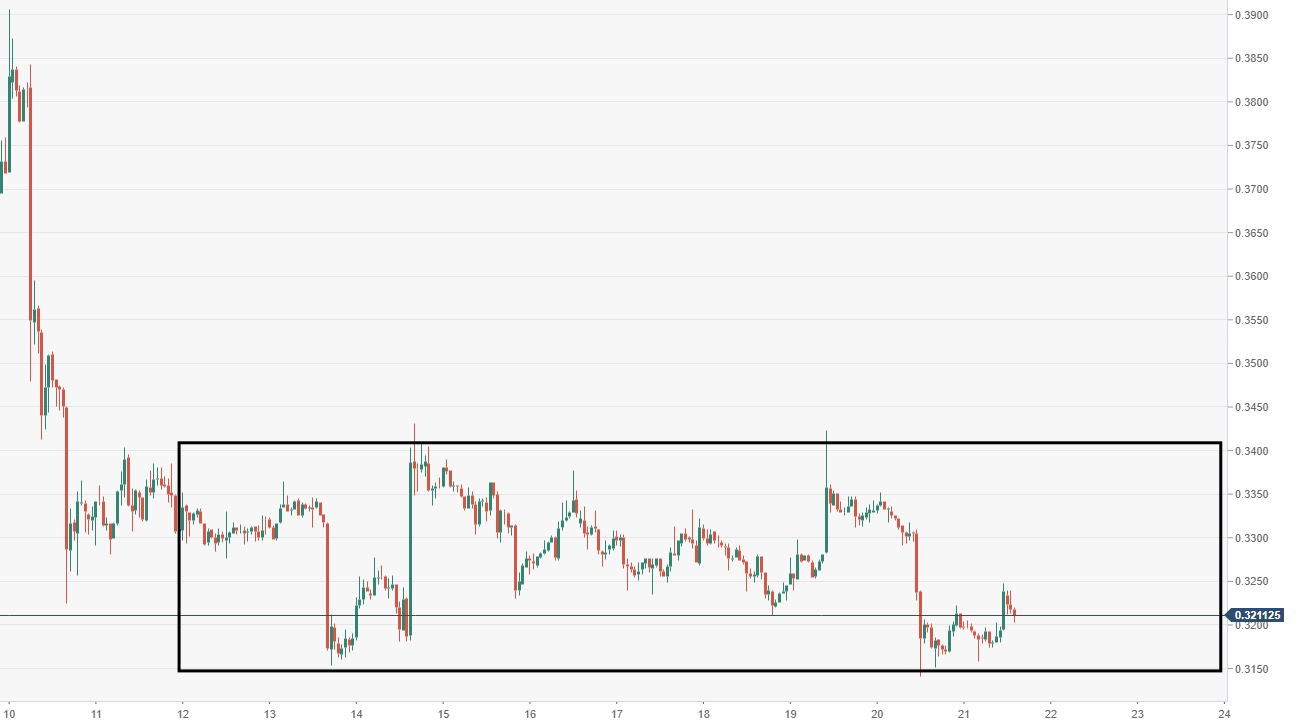
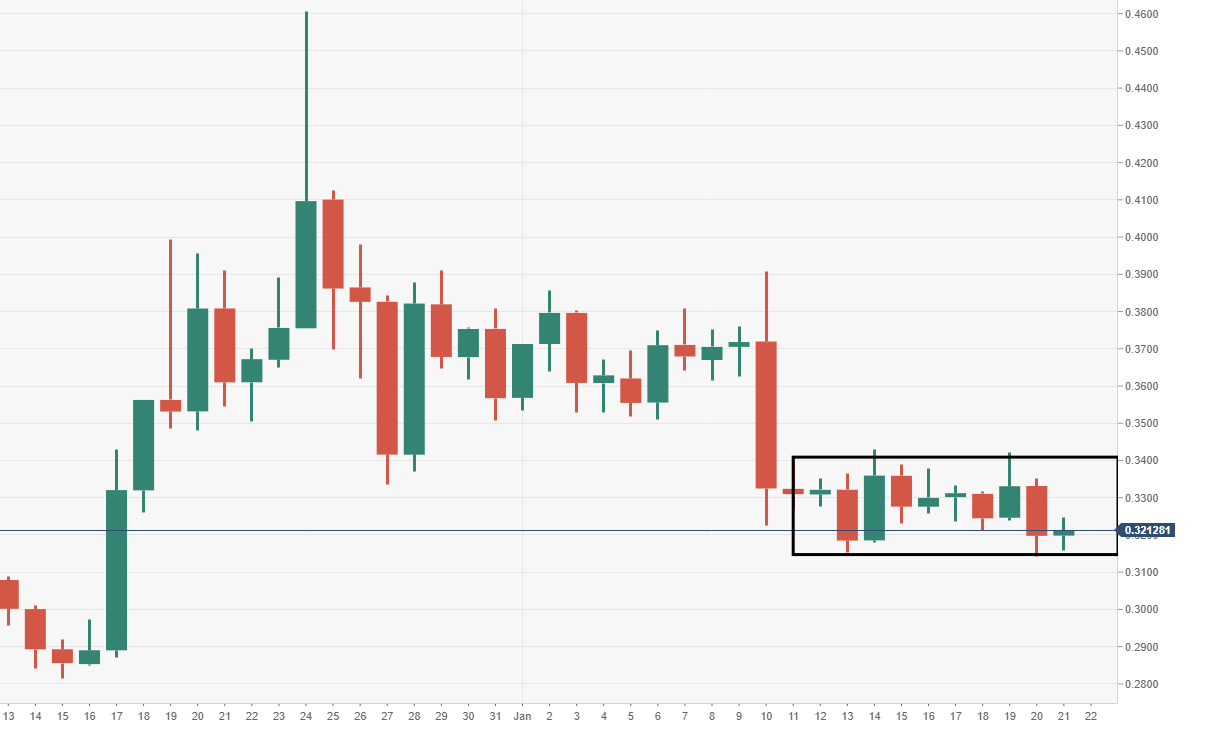
XRP/USD daily chart
- XRP/USD is narrowing within a eleven session price range, limited movement seen.
Author

Ken Chigbo
Independent Analyst
Ken has over 8 years exposure to the financial markets. He started his career as an analyst, covering a variety of asset classes; forex, fixed income, commodities and equities.


