Ripple (XRP) trading analysis: Bearish sentiment persists, eyes on key support

Ripple (XRP) has seen a shift towards bearish momentum, breaking below its critical 200-day Moving Average (MA) at approximately $0.51. While a pullback is still possible, the overall trend is bearish, with $0.42 serving as the next significant support level to watch. The 4-hour chart confirms this bearish sentiment, although a potential bullish scenario remains if buyers can break above and confirm a multi-month descending trendline.
Key levels
- Critical resistance: $0.51 (200-day MA)
- Immediate support: $0.42
- Potential bullish turnaround: $0.55 (static support)
Technical analysis
The daily chart
Ripple recently broke below its crucial 200-day MA at around $0.51, signaling a bearish outlook. This level was seen as a pivot point for the asset; its breach marks a significant shift in market sentiment towards the bearish side. The price had been consolidating near this MA since mid-August but has now succumbed to selling pressure.
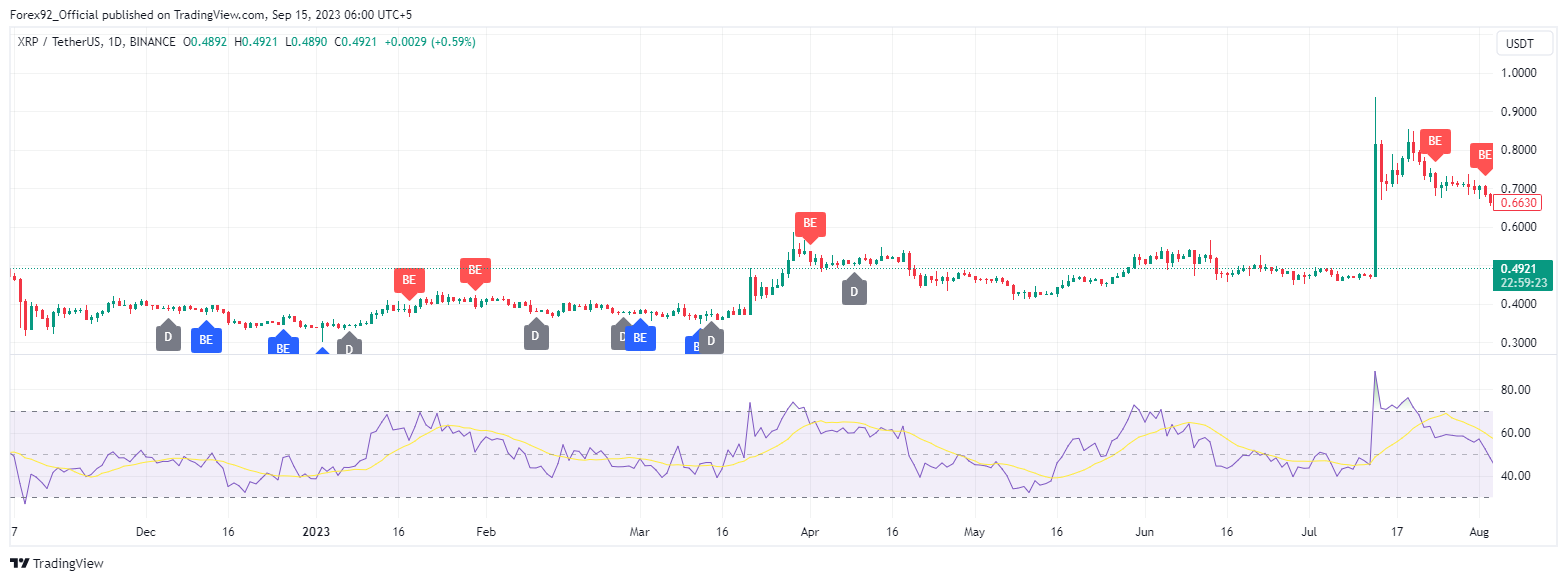
Although a pullback toward the 200-day MA is plausible, the primary expectation based on current momentum is for Ripple to target the next critical support level at $0.42. This forthcoming price action will likely determine XRP's immediate trajectory.
The 4-hour chart
The 4-hour chart shows a well-defined multi-month downtrend in Ripple's price, characterized by consistent lower highs and lower lows. The price is currently struggling against a descending trendline that serves as resistance.
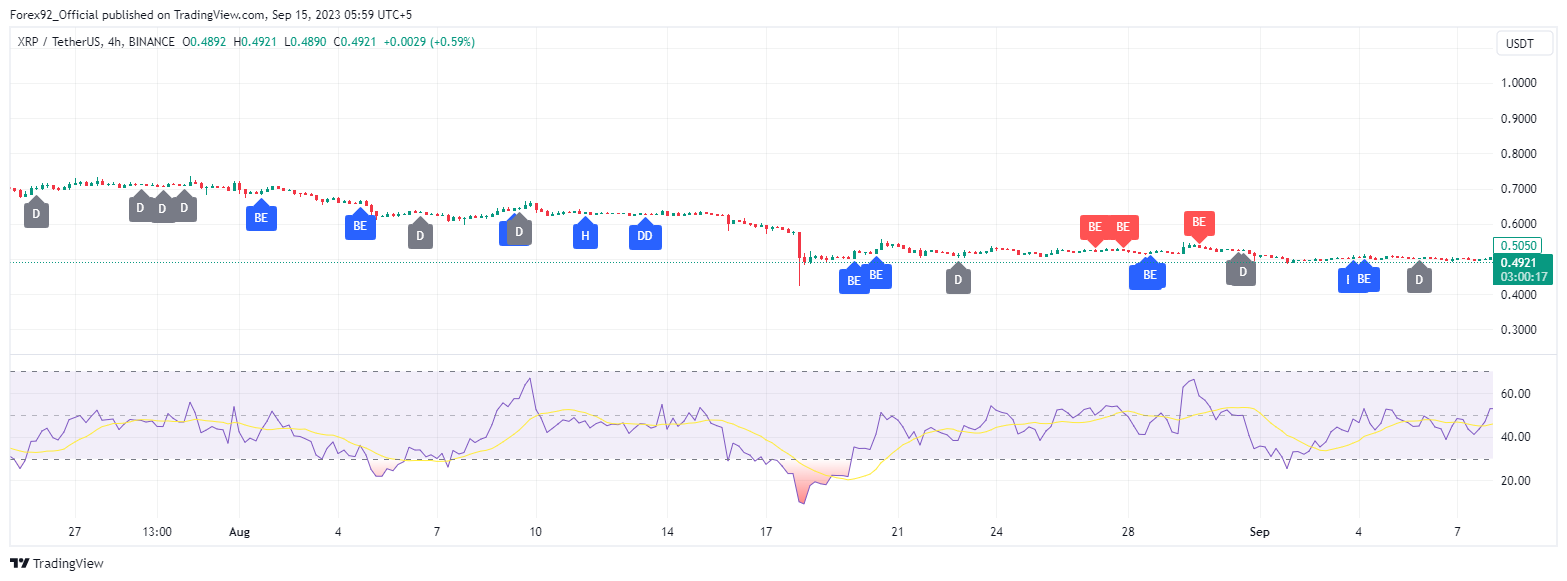
If the price rejects this trendline, expect another leg downward, possibly establishing a new lower low. Conversely, a bullish scenario would unfold if buyers can maintain the price near this trendline and push it above, followed by a successful retest during a pullback. In this case, XRP could aim for the static support turned potential resistance at $0.55.
Conclusion
The current market sentiment for Ripple is bearish, prompted by the recent breach below the critical 200-day MA. The asset is eyeing the next significant support zone at $0.42. However, traders should keep an eye on the descending trendline on the 4-hour chart for any potential reversal. A break above could change the current outlook, but until then, caution and close monitoring of price action are advised.
Note: This analysis is for informational purposes only and should not be considered as financial advice. Always do your own research before making any investment decisions.
Author

Usman Ahmed
Forex92
Usman Ahmed is a currency trader and financial market analyst with more than a decade of active trading experience.


