|

Ripple Technical Report: Path of least resistance appears to the downside for XRP/USD

  • Ripple consolidates after Friday’s drop.
  • Rangebound amid a potential symmetrical triangle on hourly chart.
  • Bearish bias likely amid a stack healthy resistance levels.

Ripple (XRP/USD) is struggling to extend its recovery momentum beyond 0.20 on Saturday, as the bulls remain in a wait-and-see for the fourth straight session. While extending the range play, the bears are seen fighting back control, as suggested by the near-term technical set up. The fourth-most favorite cryptocurrency posts minor losses around 0.2025 but remains on track to book about 2% weekly loss. Its market capitalization stands at $8.95 billion.

Short-term technical outlook

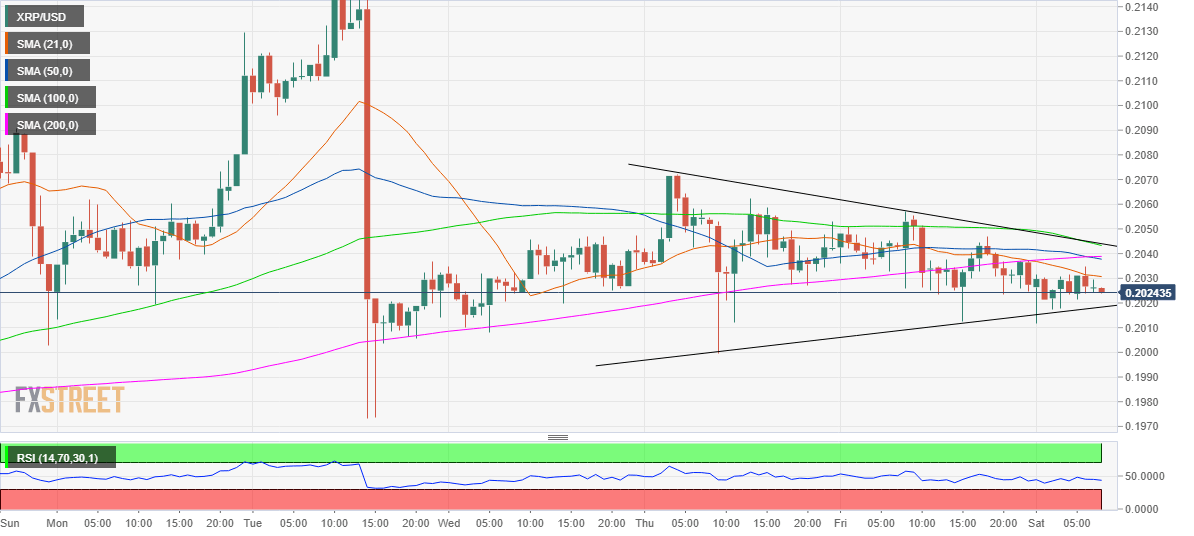
As observed on the hourly chart, the No.4 is fluctuating between gains and losses within a symmetrical triangle pattern, with a break in either direction due on the cards. Looking at the setup, however, the downside appears more compelling, as a bunch of health resistance levels continues to guard the upside.

Therefore, a test of rising trendline support at 0.2017 could be tested should the sellers take over control. A breach of the latter would confirm a triangle breakdown, with the pattern target of 0.1945 on the bears’ radar.

To the upside, strong resistance is located at 0.2038, where the horizontal 200 and 50-hourly Simple Moving Averages (HMA) intersect. Should the bulls manage to take out the aforesaid barrier, the next hurdle is seen at 0.2044, the confluence of the falling trendline resistance and bearish 100-HMA

At the moment, the hourly Relative Strength Index (RSI) has turned slightly below the midline (50.0), backing the case for the downside.

XRP/USD 1-hour chart

XRP/USD key levels to consider

XRP/USD

Overview
Today last price0.2025
Today Daily Change-0.0001
Today Daily Change %-0.05
Today daily open0.2027
 
Trends
Daily SMA200.201
Daily SMA500.2025
Daily SMA1000.195
Daily SMA2000.2141
 
Levels
Previous Daily High0.2057
Previous Daily Low0.2012
Previous Weekly High0.2147
Previous Weekly Low0.1973
Previous Monthly High0.2268
Previous Monthly Low0.178
Daily Fibonacci 38.2%0.2029
Daily Fibonacci 61.8%0.204
Daily Pivot Point S10.2007
Daily Pivot Point S20.1988
Daily Pivot Point S30.1963
Daily Pivot Point R10.2052
Daily Pivot Point R20.2077
Daily Pivot Point R30.2097

Author

Dhwani Mehta

Dhwani Mehta

FXStreet

Residing in Mumbai (India), Dhwani is a Senior Analyst and Manager of the Asian session at FXStreet. She has over 10 years of experience in analyzing and covering the global financial markets, with specialization in Forex and commodities markets.

More from Dhwani Mehta
Share:

Editor's Picks

Ripple technical weakness persists as selling intensifies toward $1.00

Ripple grinds lower, trading around $1.10 at the time of writing on Wednesday. The sticky bearish outlook mirrors the broader crypto market, with major coins such as Bitcoin and Ethereum facing weak demand as investors de-risk.

Crypto Today: Bitcoin, Ethereum, XRP face downside pressure amid investor de-risking

Major crypto assets trade under intense headwinds on Wednesday, as market participants navigate complex geopolitical and macroeconomic environments. Bitcoin has slipped toward $61,000 after its recent rebound was sold near $64,000, leaving buyers exhausted.

Bitcoin Price Forecast: Sticky inflation fears threaten deeper sell-off in BTC

Bitcoin extends its decline on Wednesday, trading below $61,500 at the time of writing as renewed US-Iran tensions keep the risk sentiment capped. In addition, persistent capital outflows from US-listed spot Exchange Traded Funds continue to fuel selling pressure on BTC.

Pi Network extends decline as CEX outflows fail to offset bearish pressure

Pi Network edges lower on Wednesday, extending its third consecutive day of losses. The technical outlook for PI is largely bearish, with a risk of a steeper correction below $0.1184.

Bitcoin: After the bloodbath, everyone looks at $60,000
Bitcoin (BTC) hovers above $62,000 at the time of writing on Friday, weighed down by growing risk-off sentiment due to persistent geopolitical tensions in the Middle East and sticky macroeconomic uncertainty. The institutional sell-off continued to wreak havoc on capital flows, with spot Bitcoin Exchange-Traded Funds (ETFs) recording billions in outflows.