Ripple Technical Analysis: XRP/USD could be heading back south in a move that will be a complete reversal of latest bull run
- If Ripple fails to hold near-term support seen just below $0.49 at $0.4980-60, then a fast move back down to $0.4500 region.
- XRP/USD short-term bull run appears to have run out of steam, running into resistance just below $0.5200.

XRP/USD 60-minute chart
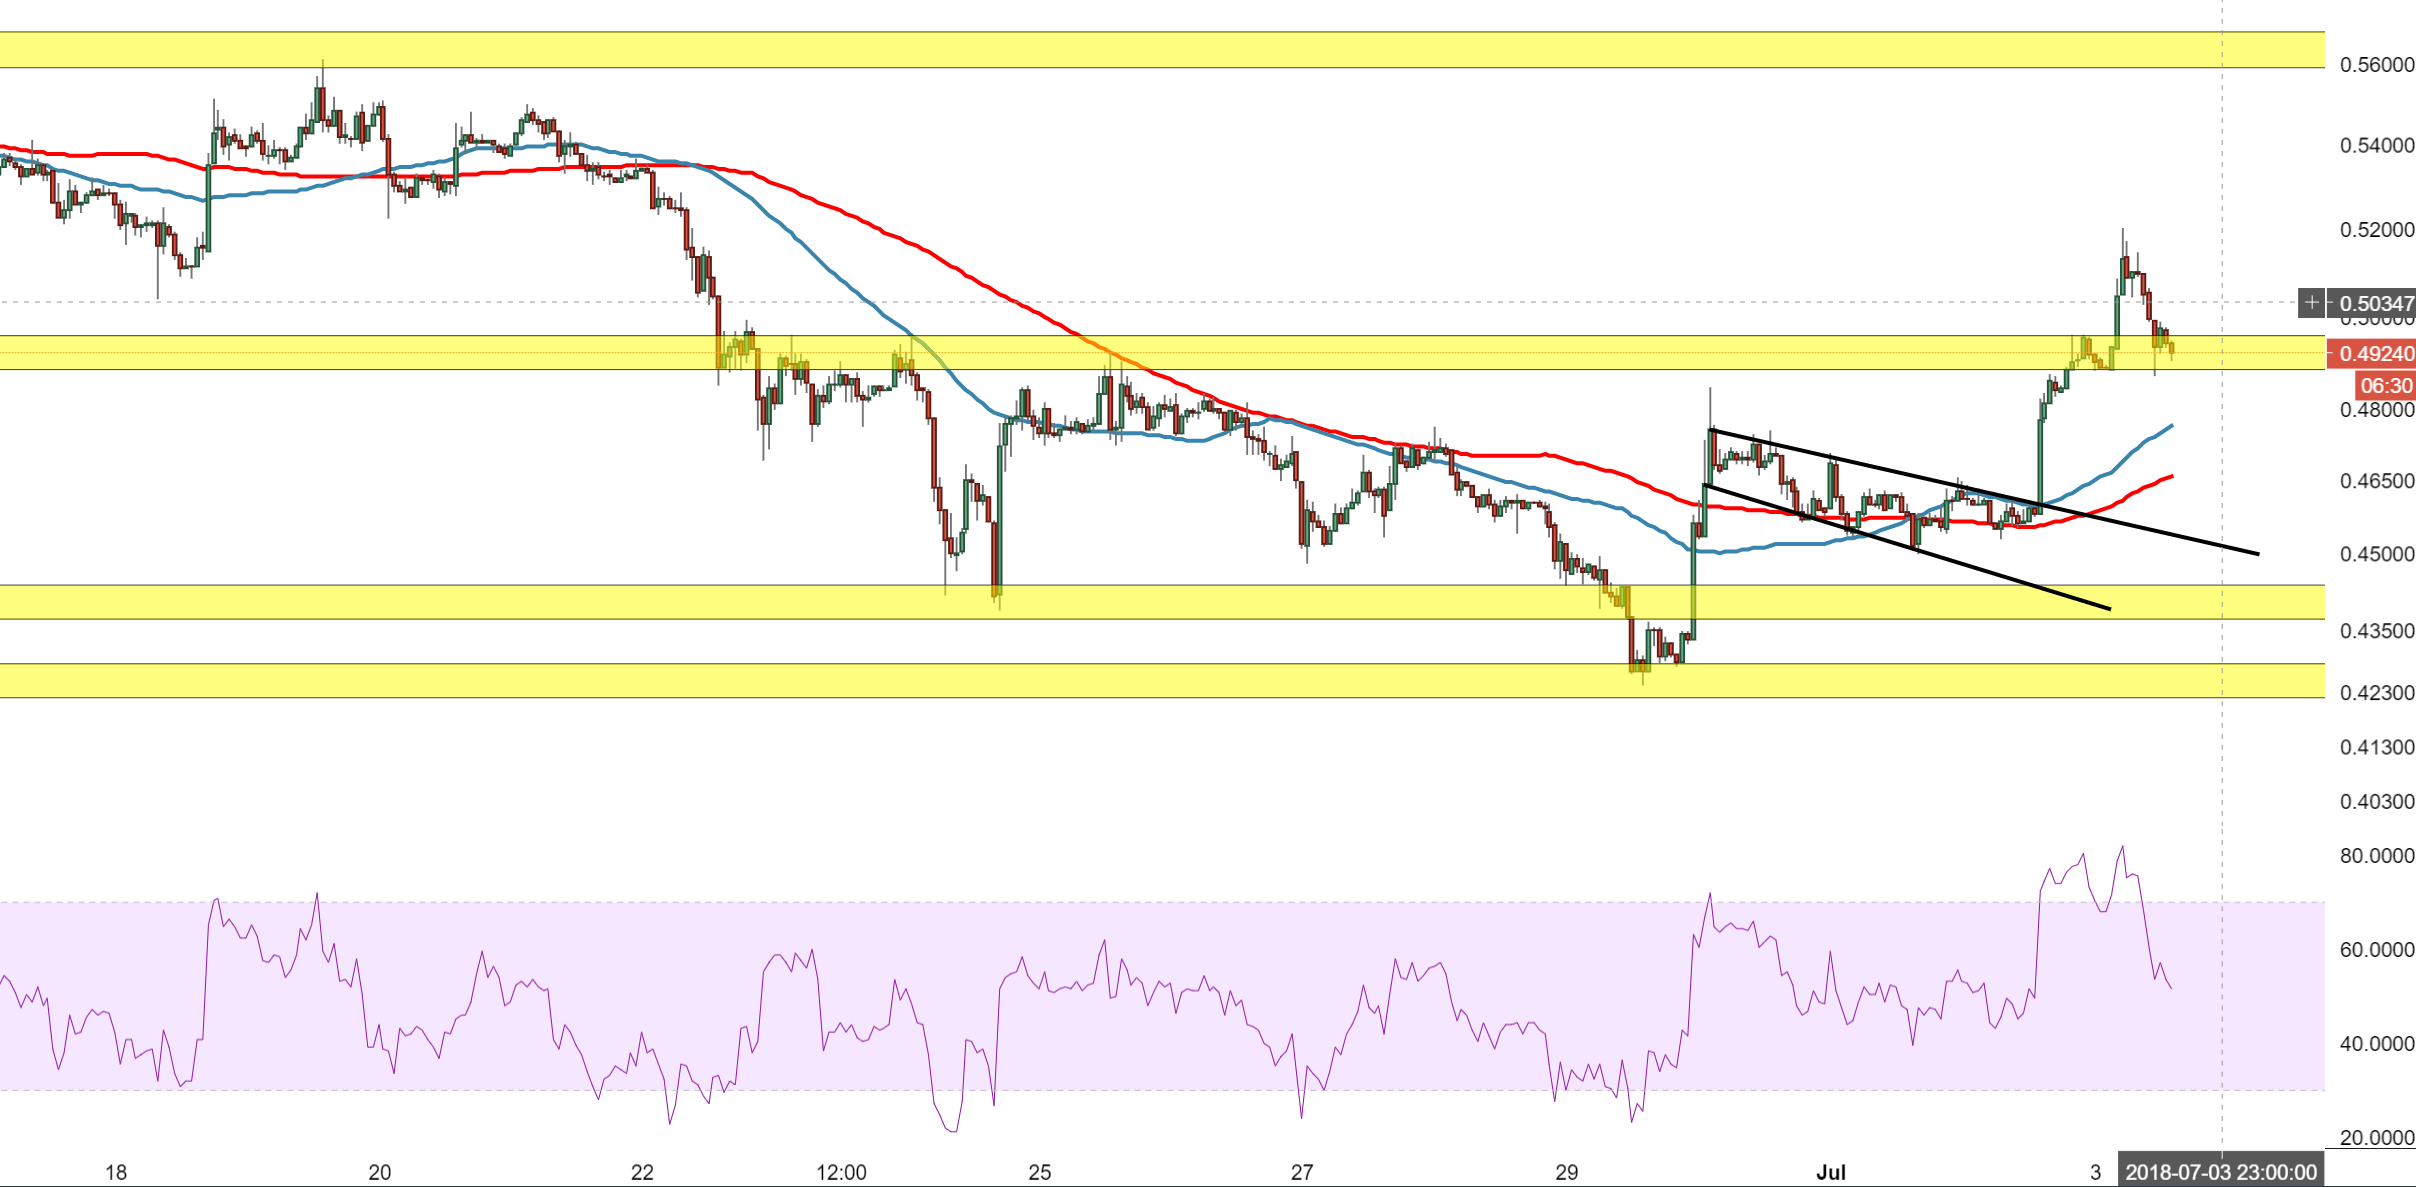
Spot rate: 0.4900
Relative change: -0.05%
High: 0.5200
Low: 0.4868
Trend: Neutral
Support 1: 0.4755, 50MA.
Support 2: 0.4662, 100MA.
Support 3: 0.4555, on top of broken bull flag.
Resistance 1: 0.5200, today’s (Tuesday) high.
Resistance 2: 0.5505, (resistance on 60-minute chart).
Resistance 3: 0.5600, entrance to supply zone.
Author

Ken Chigbo
Independent Analyst
Ken has over 8 years exposure to the financial markets. He started his career as an analyst, covering a variety of asset classes; forex, fixed income, commodities and equities.
More from Ken Chigbo


