Ripple Technical Analysis: These mild confluence resistances keep XRP/USD from $0.25
- Ripple price extends action above $0.23 for the first time since the crash mid-March.
- XRP/USD is only a few mild bumps from taking down the resistance at $0.25 and focusing on $0.30.

Ripple has for the first time in April achieved highs of $0.2357. The fight in the last six weeks has concentrated on coming out of the ‘crypt’ the price fell into amid the COVID-19-triggered crash in both the digital asset market and the traditional markets. While the recovery was not rapid in the first five weeks, the progress made this week has been tremendous.
The break above $0.20 level on Tuesday was the green light investors needed to increase their entries and positions in XRP. The last 48 hours have seen Ripple surge to highs above $0.23. At the moment, the price is flirting with the confluence formed by the 50% Fibonacci level of the last swing high at $0.3468 to a swing low at $0.11 and the 200-day SMA. Buyers have their eyes on $0.24 (short term resistance) but trading above $0.25 is key to changing the focus to $0.30. All technical indicators including the MACD and the RSI cement the buyers’ growing influence over the XRP/USD.
XRP/USD daily chart
 (9)-637238185190507804.png)
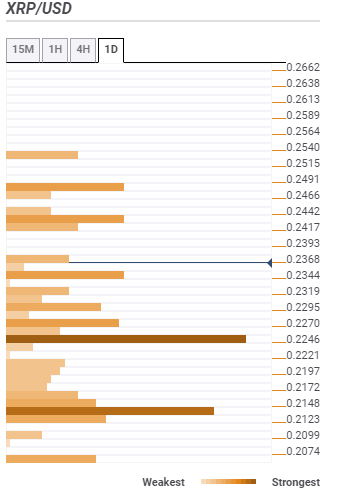
Confluence resistance and support levels
Resistance one: $0.2368 – The confluence tool highlights the previous high 15-minutes, the previous high 1-hour and the previous high 4-hour in this zone.
Resistance two: $0.2442 – Seller congestion highlighted by the pivot point one-month resistance one.
Resistance three: $0.2491 – Home to the previous month high.
Support one: $0.2246 – The strongest support brought to light by the Bollinger band 15-mins lower, the Fibo 38.2% one-day and the pivot point one-week resistance three.
Support two: $0.2148 – This region convergence the BB one-day upper curve and the SMA 200 15-mins.
Author

John Isige
FXStreet
John Isige is a seasoned cryptocurrency journalist and markets analyst committed to delivering high-quality, actionable insights tailored to traders, investors, and crypto enthusiasts. He enjoys deep dives into emerging Web3 tren


