|

Ripple technical analysis: 50-HMA caps downside following symmetrical triangle breakdown

  • Symmetrical triangle bearish break finds support at 50-HMA on Saturday.
  • Recovery to run into strong resistance near 0.3435 region.

The XRP bears are back in charge following Friday’s 5% rally, knocking-off Ripple (XRP/USD) nearly 1.50% lower so far this Saturday. The third-most traded cryptocurrency is back on the 0.33 handle, tracking the sell-off across the crypto space. Despite the latest declines, the coin trades with a market capitalization of about $ 14.45 billion.

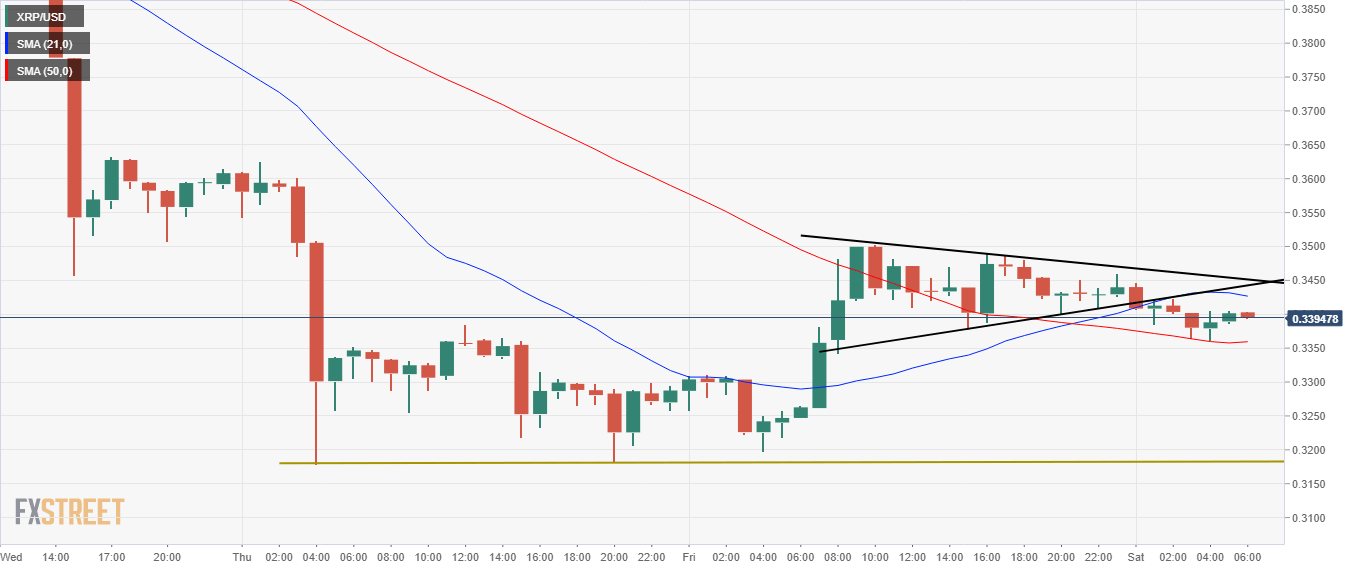
From a technical perspective, XRP/USD broke its overnight consolidative mode to the downside, with a symmetrical triangle breakdown witnessed below the 0.3417 level on the hourly sticks in the opening hours this Saturday. The cryptocurrency saw some follow-through selling interest on the bearish break, only to find some fresh bids at the 50-hourly Simple Moving Average (HMA) now placed at 0.3358 over the last hour.

The bulls are now attempting a tepid bounce and manage to regain the 0.34 handle. But the further upside looks to run into a strong resistance aligned near 0.3435 region, the confluence of the 21-HMA and the ascending trend-line support of the triangle. The buyers will regain complete control above the last, opening doors for a retest of the 0.4000 level.

Should the bulls fail to clear the above-mentioned resistance, the 50-HMA support be back on the radar. Below which, selling pressure is likely to intensify that could put the next support at 0.3181 at risk.

XRP/USD 1-hour chart
 

Levels to watch

XRP/USD

Overview
Today last price0.3401
Today Daily Change-0.0039
Today Daily Change %-1.13
Today daily open0.344
 
Trends
Daily SMA200.4056
Daily SMA500.4141
Daily SMA1000.3754
Daily SMA2000.3498
Levels
Previous Daily High0.3504
Previous Daily Low0.3197
Previous Weekly High0.4081
Previous Weekly Low0.3179
Previous Monthly High0.5074
Previous Monthly Low0.3704
Daily Fibonacci 38.2%0.3387
Daily Fibonacci 61.8%0.3314
Daily Pivot Point S10.3257
Daily Pivot Point S20.3074
Daily Pivot Point S30.2951
Daily Pivot Point R10.3563
Daily Pivot Point R20.3686
Daily Pivot Point R30.3869

Author

Dhwani Mehta

Dhwani Mehta

FXStreet

Residing in Mumbai (India), Dhwani is a Senior Analyst and Manager of the Asian session at FXStreet. She has over 10 years of experience in analyzing and covering the global financial markets, with specialization in Forex and commodities markets.


More from Dhwani Mehta
Share:

Editor's Picks

Cardano Price Forecast: Approaches critical support as correction risks grow
Cardano (ADA) recovers slightly, trading at $0.206 at the time of writing on Friday, inches above the critical support zone after losing more than 6% so far this week. Weakening derivatives data and fading bullish momentum suggest a bearish near-term outlook, with a decisive close below the support zone potentially triggering a deeper correction for ADA.
Crypto Overview: Bitcoin slips below $77,000 – Raydium, Falcon Finance hold gains

Bitcoin price trades below $77,000 on Friday, extending its capitulation from the previous week’s high at $82,300. Broader market consensus points to a higher likelihood that the US Federal Reserve could raise interest rates at the September meeting, as inflation concerns rise amid the war with Iran.

Top 3 Price Prediction: Bitcoin, Ethereum, Ripple – BTC pullback, ETH stalls, XRP weakens
Bitcoin (BTC), Ethereum (ETH) and Ripple (XRP) remain under pressure on Friday as the broader cryptocurrency market extends its losses over 4%, 2.5% and 5%, respectively, this week.
Ethereum Price Forecast: ETH holds above $2,400 as PPI data strengthens rate hike expectations
Ethereum (ETH) is down 0.7% on Thursday as the second-largest cryptocurrency looks to recover from earlier pressure following the release of stronger US inflation data. The Producer Price Index (PPI) for final demand rose 0.4% in August, matching market expectations after a revised 0.1% increase in July, according to the US Labor Department.
Bitcoin: Gearing up for a sharp move
Bitcoin (BTC) is trading around $81,000 on Friday, up over 4% so far this week, and awaits a key catalyst that could determine its next directional move. Strong institutional demand is supporting the bullish price action, with spot BTC Exchange Traded Funds (ETFs) on track to record a third straight week of inflows.


