Ripple Price Prediction: XRP faces almost no opposition until $0.30
- XRP is currently trading at $0.251 after a notable rebound from the low at $0.219.
- The digital asset seems to be recovering and faces very little resistance to the upside.

XRP had a strong start in 2020, climbing from $0.188 in January to a high of $0.33 only one month and a half later. Unfortunately, the crash of March was devastating for the digital asset, which hasn’t recovered fully just yet.
XRP targeting $0.30 with very little resistance ahead
The long-term for XRP looks excellent after bulls managed to establish a weekly uptrend. The low at $0.1129 on March 13 was followed by a higher low at $0.169 on June 26 and the last one at $0.219 on September 25.
XRP/USD weekly chart
-637390709474546411.png)
The 50-SMA has been acting as a healthy support level since the breakout on July 31. The only real resistance level before $0.30 could be the 100-SMA, currently located at $0.275. However, the MVRV chart shows that XRP has a lot of room to go up before any kind of pullback.
XRP MVRV Chart
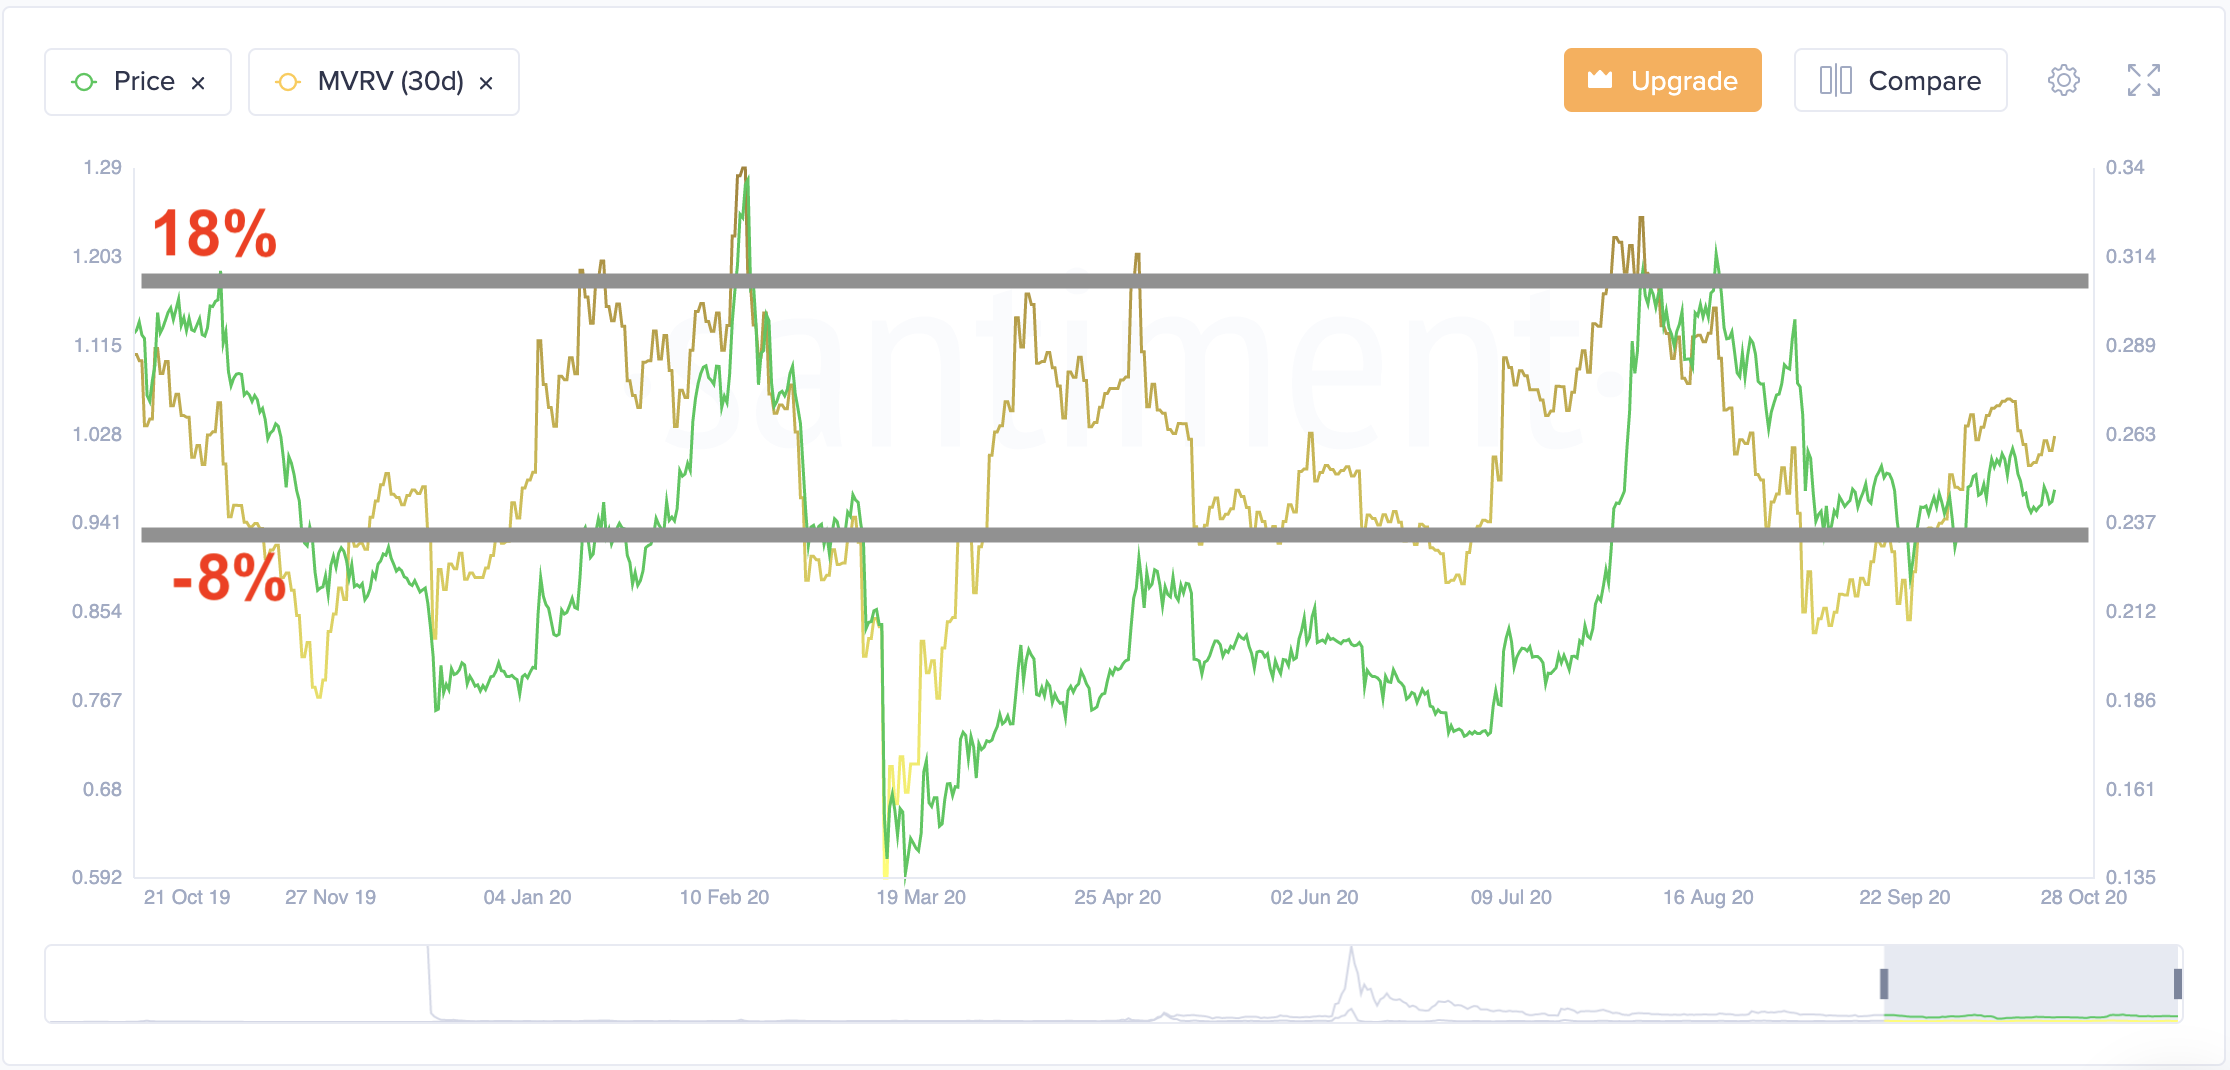
This ratio is an accurate indicator of upcoming bounces and pullbacks. Historically, when the MVRV climbs above 18%, XRP suffers a significant pullback. On the other hand, when it goes below -8%, a rebound usually follows. The current number is far away from the critical 18% level, which means a strong pullback will not happen any time soon.
XRP/USD daily chart
-637390709577835005.png)
On the daily chart, the price of XRP has risen above the 50-SMA, and it’s currently trying to turn the 100-SMA into a support level. There is only one significant resistance point at $0.257 ahead. A breakout above it can drive the digital asset’s price towards $0.30. The MACD also turned bullish again for the first time since September 25.
The other side of the coin
However, at the same time, rejection from the $0.257 resistance level on the daily chart can be considered a notable bearish sign. XRP could slip as low as $0.245, where the 50-SMA is currently standing on the daily chart.
XRP Holders Distribution Chart
 [19.27.11, 23 Oct, 2020]-637390709831291861.png)
Furthermore, it seems that XRP whales are cashing out. The holders distribution chart shows that whales with 10,000,000 or more coins are exiting the network from a peak of 313 whales on October 21 to 309 currently. This adds some support for the theory of a short-term pullback.
Author

Lorenzo Stroe
Independent Analyst
Lorenzo is an experienced Technical Analyst and Content Writer who has been working in the cryptocurrency industry since 2012. He also has a passion for trading.




