Ripple Price Forecast: Two key factors holding XRP price steady
- XRP price gradually extends gains as the cryptocurrency market holds steady.
- XRP holds above critical support at $2.22, strengthened by the 100-day EMA.
- A breakout from the descending channel could spark significant bullish momentum, potentially driving a rally past $3.
- The surge in long-position liquidations while Open Interest remains unchanged signals declining interest and a potential pullback.

Ripple (XRP) price consolidates gains at the time of writing on Tuesday, following three consecutive daily green candles. Trading at $2.26, XRP is down over 1% on the day, mirroring the stability in the broader crypto market. A pullback from the current market level seems possible, but it may not deter investors from seeking exposure, thereby increasing the tailwind for a breakout aiming for $3.00.
Bitcoin (BTC) remains above $94,000, with its uptrend driven by surging net inflows into spot BTC ETFs, easing trade tensions between the United States (US) and China, as well as short squeezes.
Select altcoins, including Virtuals Protocol, Floki, and Hyperliquid (HYPE), are extending their lead, suggesting that investors are shifting their attention to lesser-known coins that achieve higher profit margins.
XRP price nurtures potential breakout to $3
XRP’s price generally drops within the confines of a descending channel. However, since the cross-border money remittance token rebounded from its yearly low at $1.61 on April 7, the potential for a rally beyond $3.00 significantly increased.
Despite the rejection of $2.36, a level tested on Monday, XRP maintains its position above the 50, 100, and 200-day Exponential Moving Averages (EMAs), confirming bullish momentum. The EMAs are sloping upward, further reinforcing a strong bullish trend.
The 50-day and 100-day EMAs provide immediate support at $2.20 and $2.22, respectively. A reversal to these levels is possible, and XRP could collect more liquidity as traders buy the dip.
The Relative Strength Index (RSI) indicator’s neutral position at 58.11 could hold the scales in the bulls’ favor, especially if it stays above the midline of 50. This could increase the potential for a breakout above the descending channel.
Beyond the seller congestion at $2.40, supply zones at $2.80 and $3.00 are worth remembering as they could slow the potential XRP rally. Higher volume on upward moves will be crucial in pushing XRP toward $3.00.
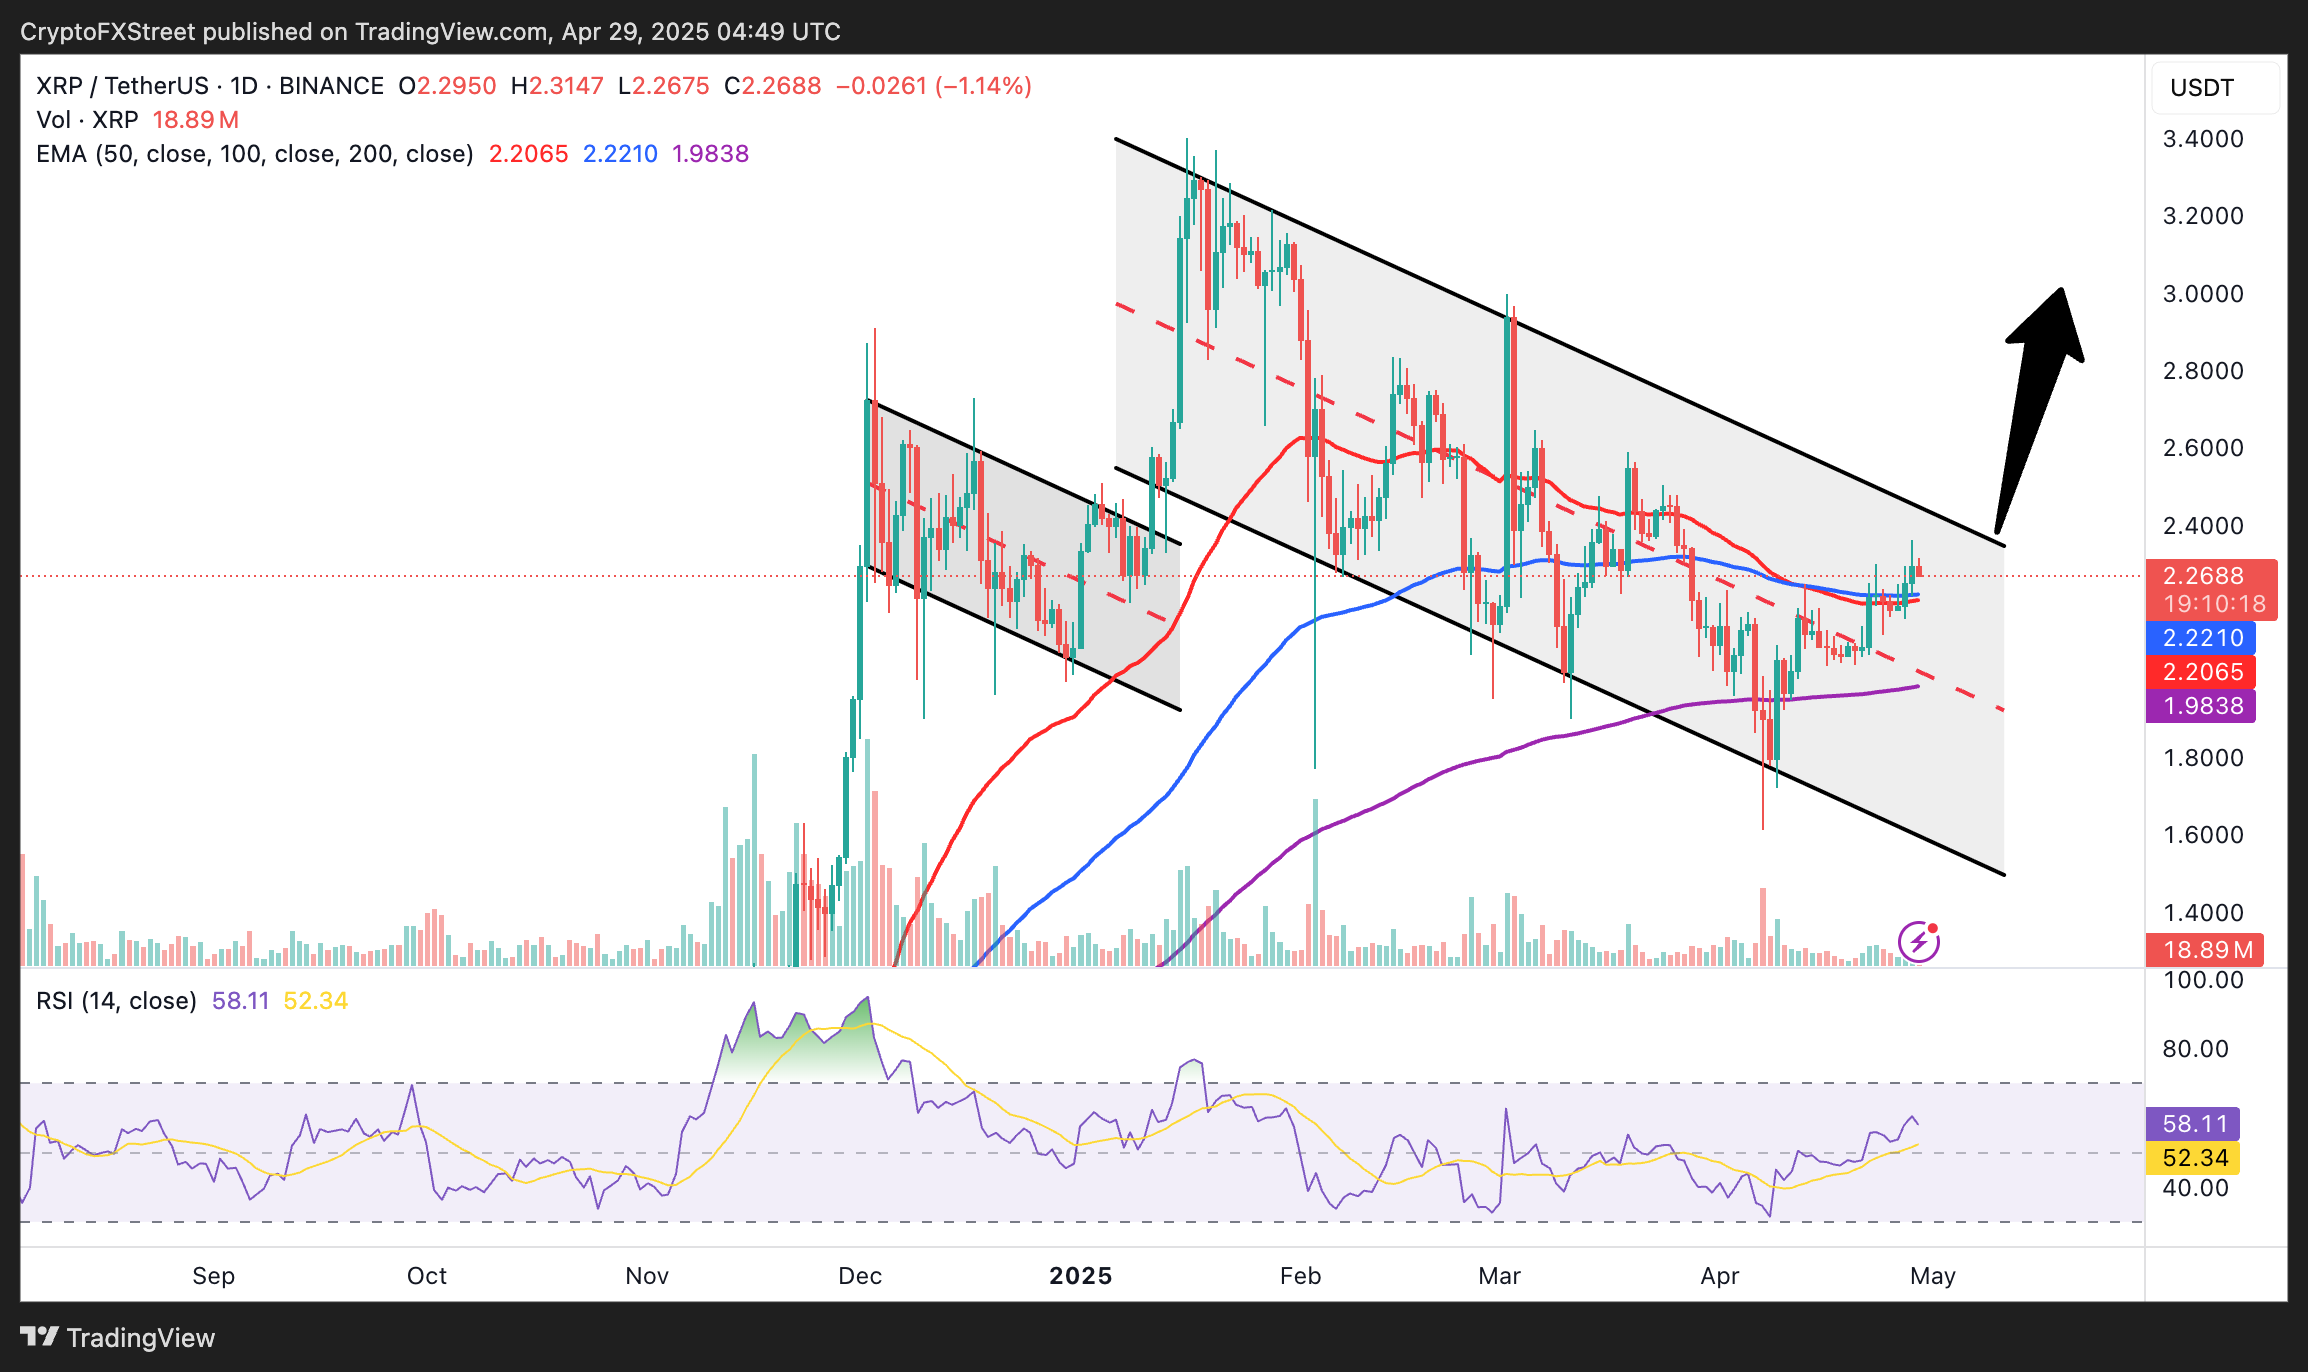
XRP/USDT daily chart
Factors that could keep XRP price elevated
Several developments could support XRP’s bullish outlook in the near term, including ongoing talks between Ripple and the Securities and Exchange Commission (SEC) regarding a potential settlement. Earlier this month, Ripple and the SEC were granted a temporary stay of the appeals process, allowing for settlement negotiations and enabling the SEC’s commissioners to vote on the matter.
The recently approved futures XRP ETFs could help bolster the token’s bullish outlook over the coming months. Moreover, Ripple’s intentional push to the stablecoin market and tokenization services boosts sentiment.
The derivatives data from Coinglass highlights a slight increase in Open Interest (OI) of 0.09% to $4 billion, indicating that new positions are being opened, which reflects growing trader interest.
The long/short ratio of 0.9559 leans towards shorts rather than longs, indicating that confidence among traders is waning. Over $350,000 was liquidated in long positions compared to approximately $59,000 in short positions in the past four hours, suggesting that bulls are being shaken out, which may potentially weaken the bullish outlook.
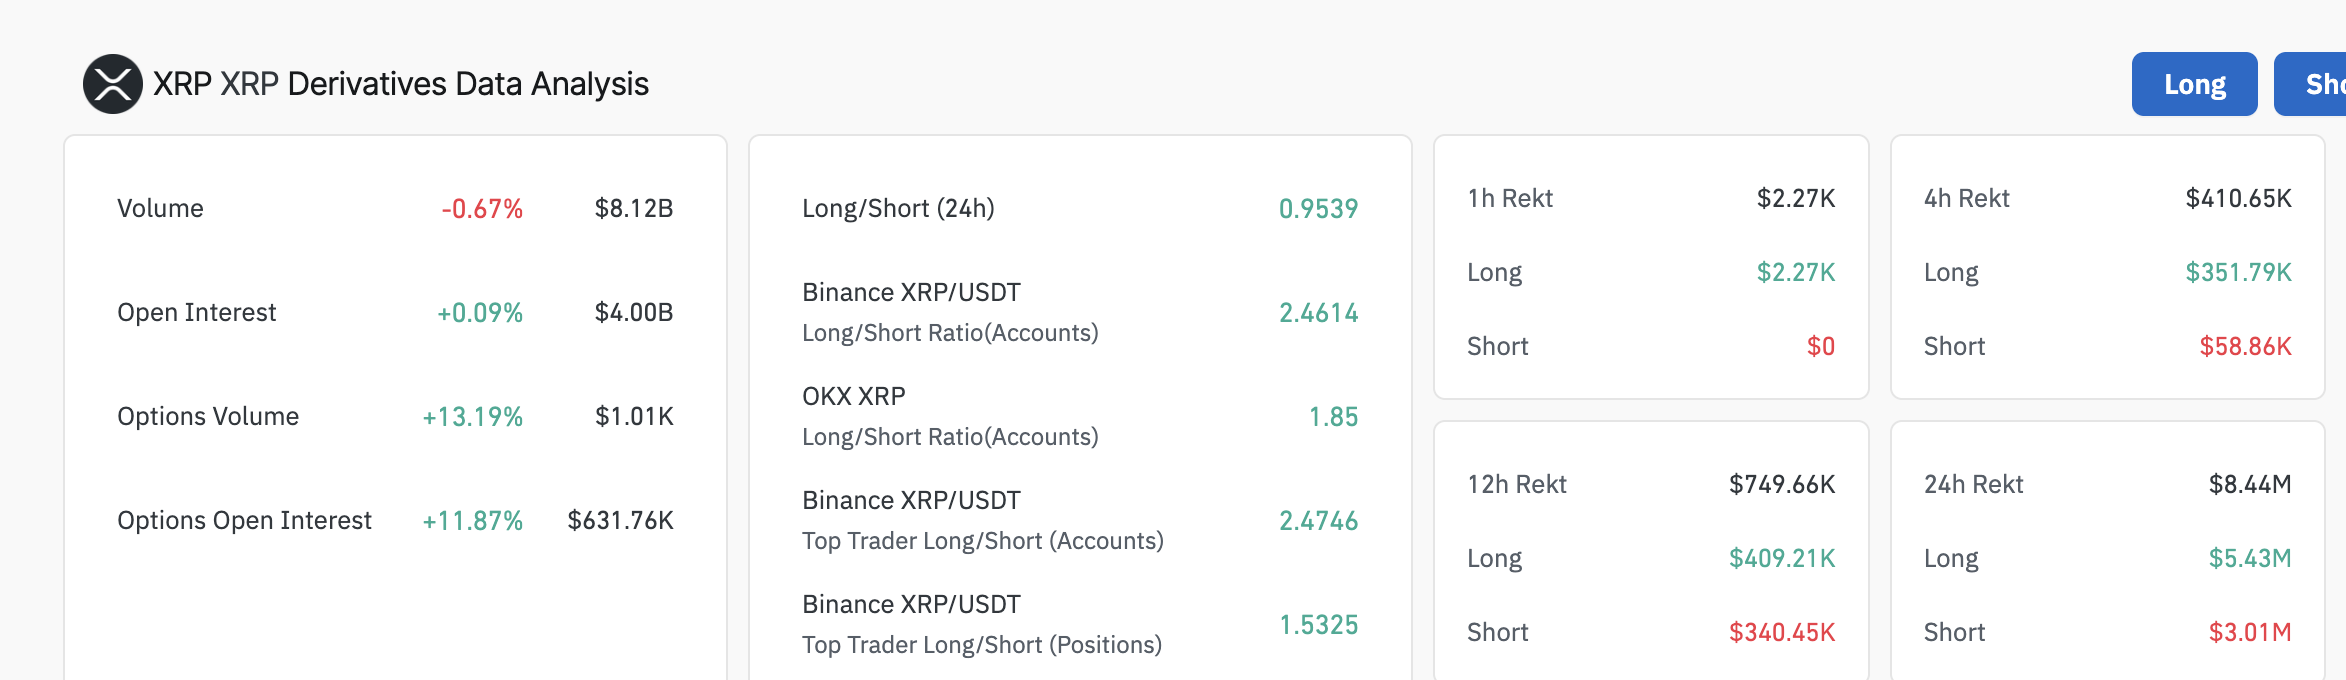
XRP derivatives’ Open Interest | Source: Coinglass
Beyond the support provided by the 50-day and the 100-day EMAs, XRP could extend the down leg to retest the 200-day EMA at $1.98. A deeper correction to $1.80 is possible if the broader crypto market sentiment turns bearish.
Open Interest, funding rate FAQs
Higher Open Interest is associated with higher liquidity and new capital inflow to the market. This is considered the equivalent of increase in efficiency and the ongoing trend continues. When Open Interest decreases, it is considered a sign of liquidation in the market, investors are leaving and the overall demand for an asset is on a decline, fueling a bearish sentiment among investors.
Funding fees bridge the difference between spot prices and prices of futures contracts of an asset by increasing liquidation risks faced by traders. A consistently high and positive funding rate implies there is a bullish sentiment among market participants and there is an expectation of a price hike. A consistently negative funding rate for an asset implies a bearish sentiment, indicating that traders expect the cryptocurrency’s price to fall and a bearish trend reversal is likely to occur.
Author

John Isige
FXStreet
John Isige is a seasoned cryptocurrency journalist and markets analyst committed to delivering high-quality, actionable insights tailored to traders, investors, and crypto enthusiasts. He enjoys deep dives into emerging Web3 tren


