|

Ripple price is in a free-fall towards $0.35, according to several indicators

  • Ripple price has broken down from a symmetrical triangle pattern on the 4-hour chart.
  • The next bearish price target seems to be all the way down at $0.356.

In our last XRP technical analysis article, we discussed the possibility of a breakout or breakdown for Ripple price in the short-term from a symmetrical triangle pattern. Unfortunately, it seems that the bears managed to win and are eying up $0.356.

Ripple price faces very little support on the way down

On December 4, Ripple price had a breakdown from a symmetrical triangle pattern on the 4-hour chart which has a price target of $0.356. XRP also lost the 50-SMA support level and it’s now trading at $0.57.

xrp price

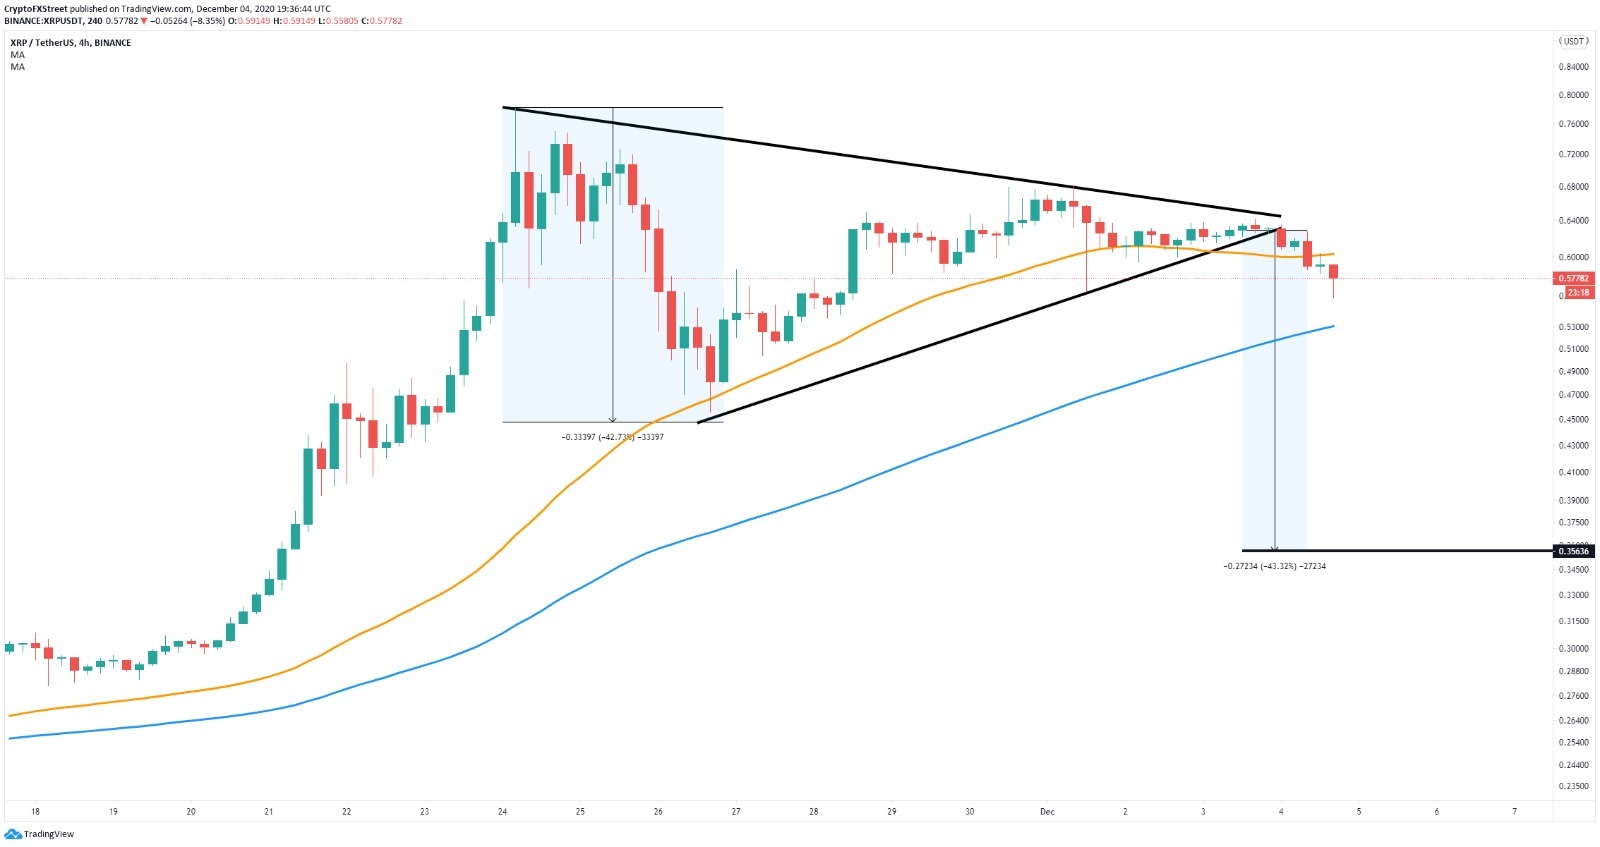
XRP/USD 4-hour chart

The nearest price target is the 100-SMA support level at $0.53. A breakdown from this point will quickly drive Ripple price to $0.356. On the other hand, bulls haven’t lost hope just yet as XRP holders will be able to receive an airdrop from the Flare Network platform on December 12.

The Spark airdrop is only for XRP holders which is increasing the demand for the digital asset and buying pressure. Bulls need to push Ripple price above the 50-SMA at $0.60 and turn it into a support level.

Author

Lorenzo Stroe

Lorenzo Stroe

Independent Analyst

Lorenzo is an experienced Technical Analyst and Content Writer who has been working in the cryptocurrency industry since 2012. He also has a passion for trading.

More from Lorenzo Stroe
Share:

Editor's Picks

Ripple risks extending drop as June lows come into view

Ripple (XRP) ticks down below $1.20 with short-term support at $1.16 intact at the time of writing on Thursday. An early-week rally was rejected at $1.28, weighing on sentiment as traders broadly de-risked.

Crypto Today: Bitcoin, Ethereum and XRP pare losses on increasing bets of Fed tighter monetary policy

Cryptocurrency prices are broadly moderating downwards on Thursday, as market participants assess the impact of the Fed’s hawkish monetary policy stance. Bitcoin edges lower, with support at $64,000 holding.

Bittensor Price Forecast: TAO closes in key support, risking deeper losses

Bittensor price edges below $250 at press time on Thursday, marking its fourth straight day of losses. The AI token is losing retail demand as TAO futures Open Interest dips over 8% in the last 24 hours.

Bitcoin slips below $64,000 as hawkish Fed stance weighs on risk appetite

Bitcoin remains under pressure, extending its correction, trading below $64,000 at the time of writing on Thursday. The US Fed left interest rates unchanged but struck a hawkish tone on Wednesday, dampening the risk sentiment.

Experts agree: Bitcoin nears bottom, but weak demand raises doubts
Bitcoin (BTC) is trading above $63,000 at the time of writing on Friday after rebounding from the key 200-week Simple Moving Average (SMA) near $62,000, a level widely viewed as key long-term support. The recovery may suggest that Bitcoin has found a floor after a sharp correction that spanned more than a month, but some warning signs persist.