XRP breakout renews uptrend on steady risk-on sentiment
- XRP approaches $2.70, mirroring steady risk-on sentiment in the broader cryptocurrency market.
- Demand for XRP derivatives increases as Open Interest breaks above $4.5 billion.
- The Federal Reserve is expected to cut interest rates by 25 basis points on Wednesday, potentially benefiting riskier assets such as XRP.

Ripple (XRP) edges higher in tandem with crypto majors such as Bitcoin (BTC) and Ethereum (ETH), trading above $2.65 at the time of writing on Tuesday. Interest in the cross-border remittance token has steadied over the past week, encouraging investors to consider emerging opportunities following the infamous October 10 deleveraging event.
XRP momentum builds on growing retail demand
Retail interest in XRP is gaining momentum, as evidenced by the futures Open Interest (XRP), which averages $4.51 billion on Tuesday. According to CoinGlass data, OI, which tracks the notional value of outstanding futures contracts, plunged to $3.49 billion on October 19, the lowest level since late April, as risk-off sentiment spread across the cryptocurrency market amid broader macroeconomic uncertainty and the trade stand-off between the US and China.
The increase in OI suggests that risk appetite is returning among retail traders, which may continue to support the current recovery.
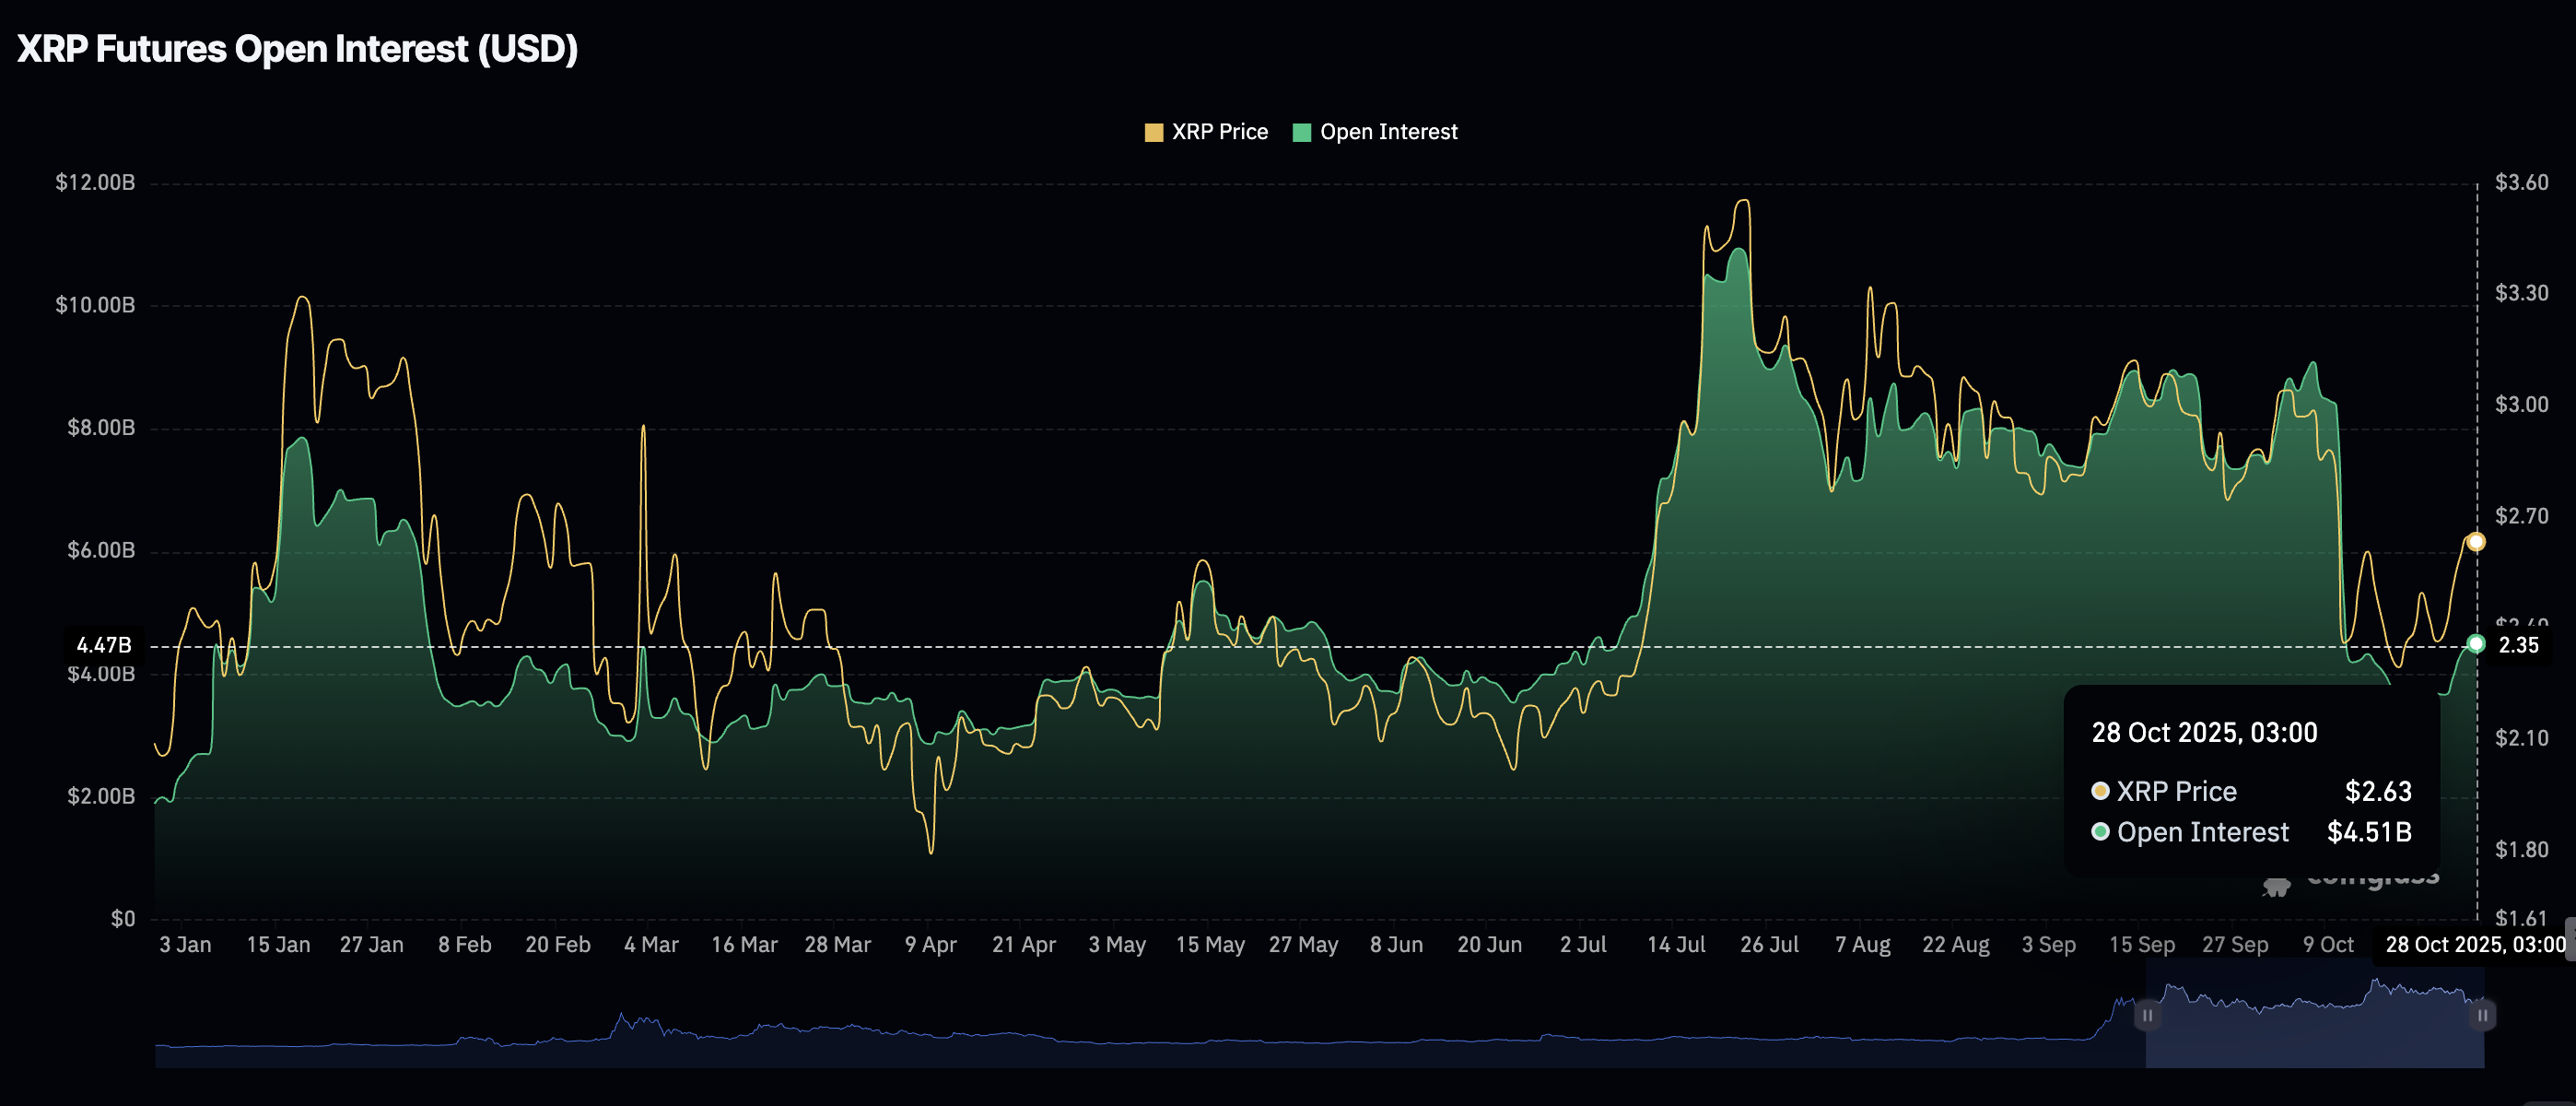
XRP Open Interest | Source: CoinGlass
Still, caution is advised, as the OI-Weighted Funding Rate has declined, averaging 0.0055% on Tuesday, down from 0.0093% the previous day. This shows that the increase in the futures OI to $4.51 billion falls short of strengthening investor confidence in XRP’s recovery. In other words, traders are increasingly piling into short positions, possibly anticipating another sweep at the key critical $2.18 support, last tested on October 17.
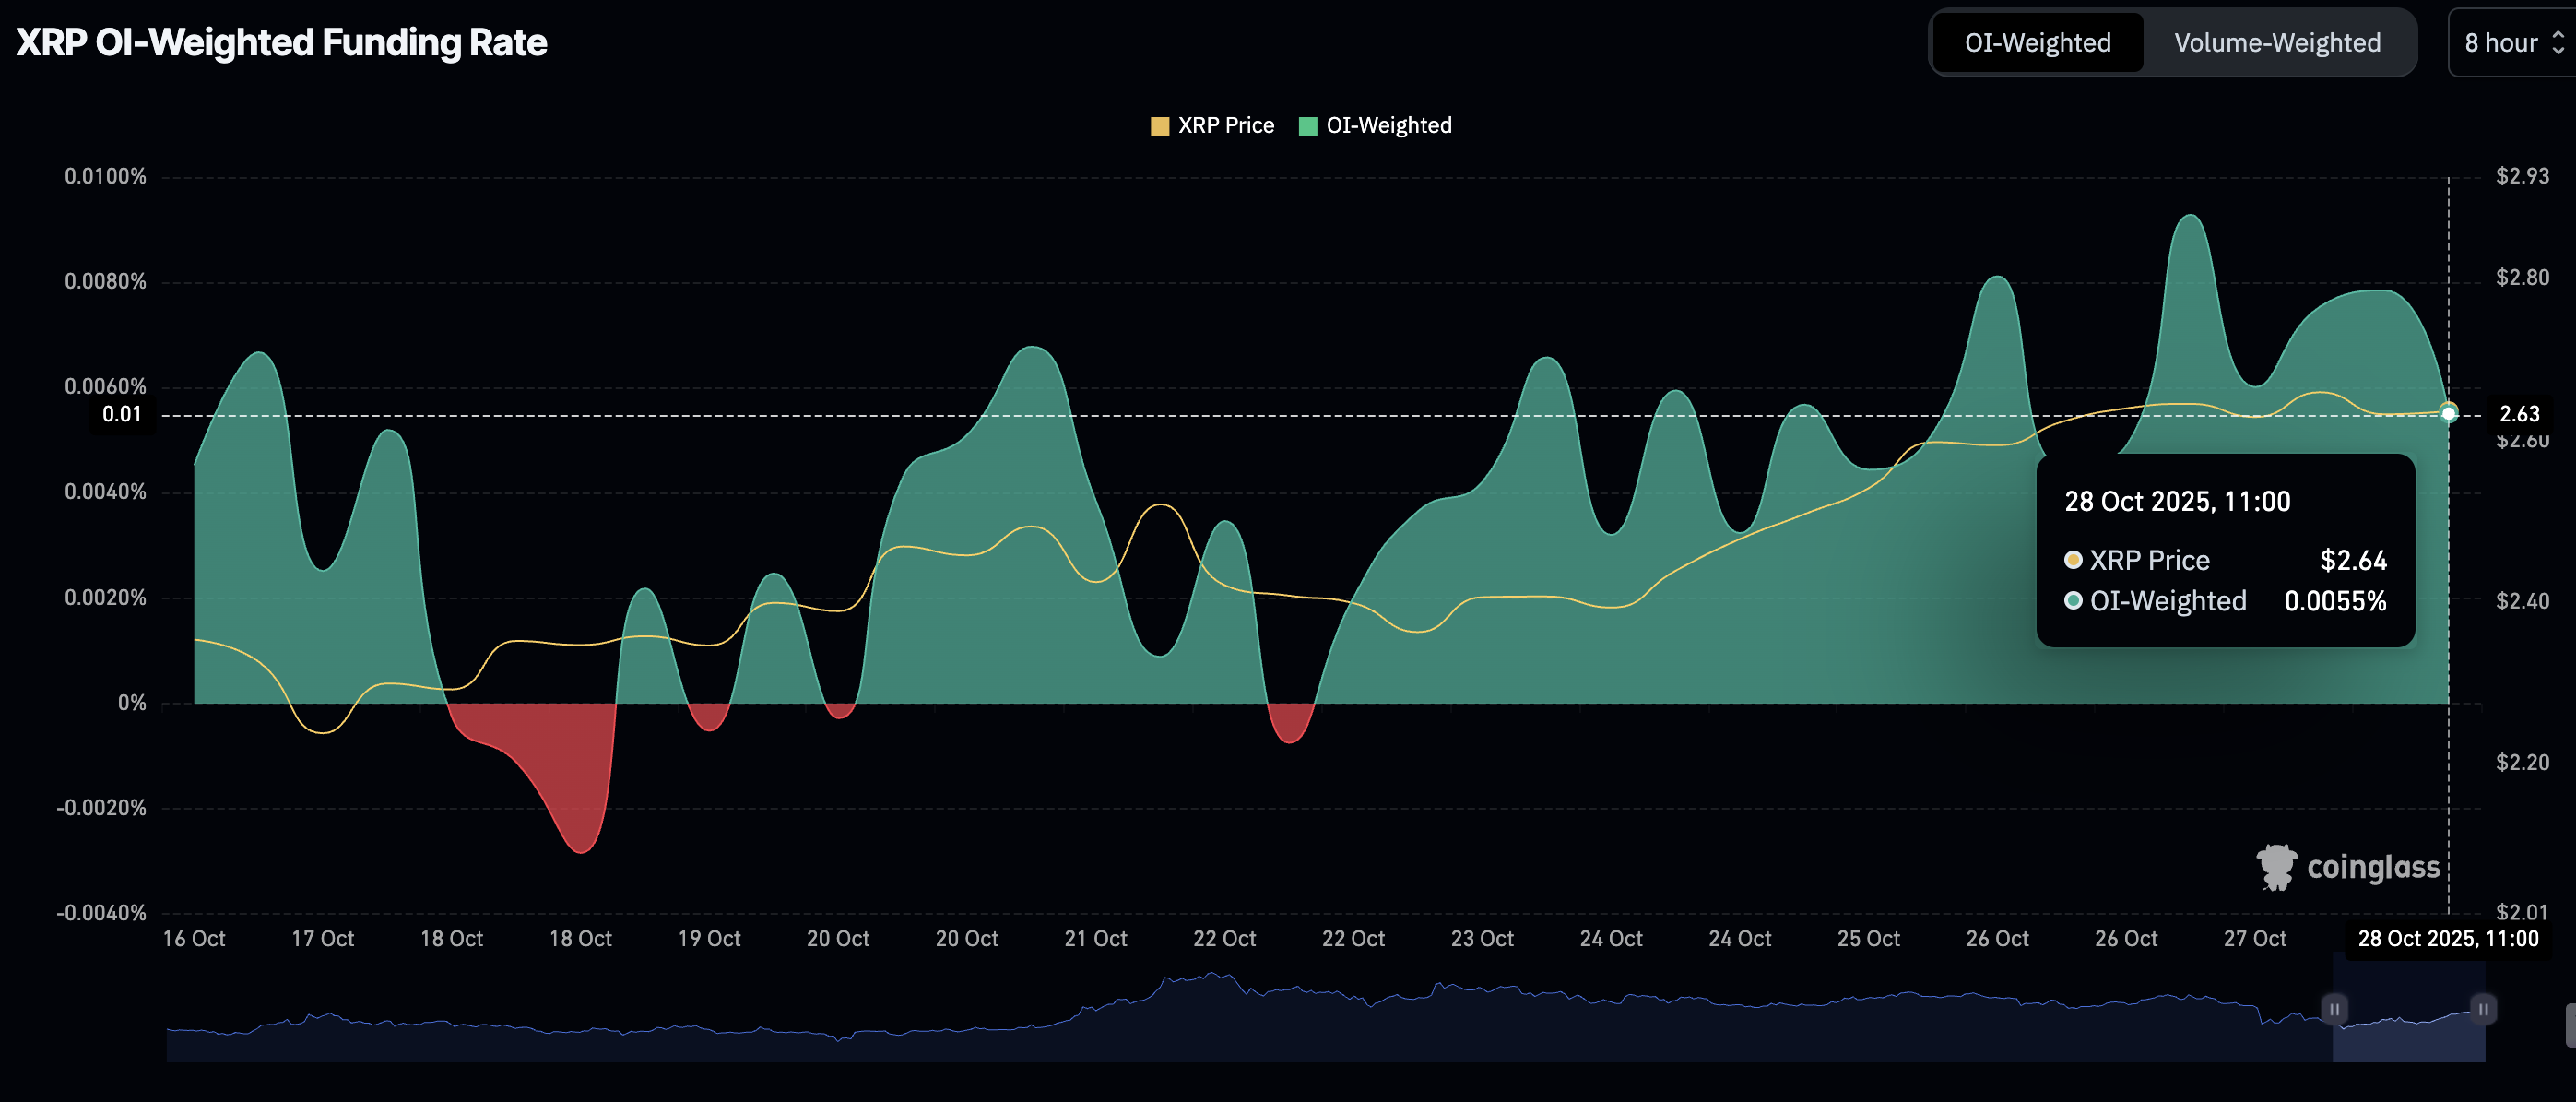
XRP OI-Weighted Funding Rate metric | Source: CoinGlass
Technical outlook: XRP uptrend lags amid profit-taking
XRP is holding above the 200-period Exponential Moving Average (EMA) at $2.65, with its upside capped below the supply area of $2.69 on the 4-hour chart. A descending trendline sits marginally below the 200-period EMA, providing additional support.
The downward-trending Relative Strength Index (RSI), currently at 62, is signaling a weakening of bullish momentum amid potential profit-taking. A steady decline in the RSI would suggest a top-heavy technical structure.
The Money Flow Index (MFI), which tracks the amount of money entering or leaving XRP, holds at 61, down from the overbought region. If this downtrend persists, it would result in a daily close below the 200-period EMA, significantly increasing profit-taking.
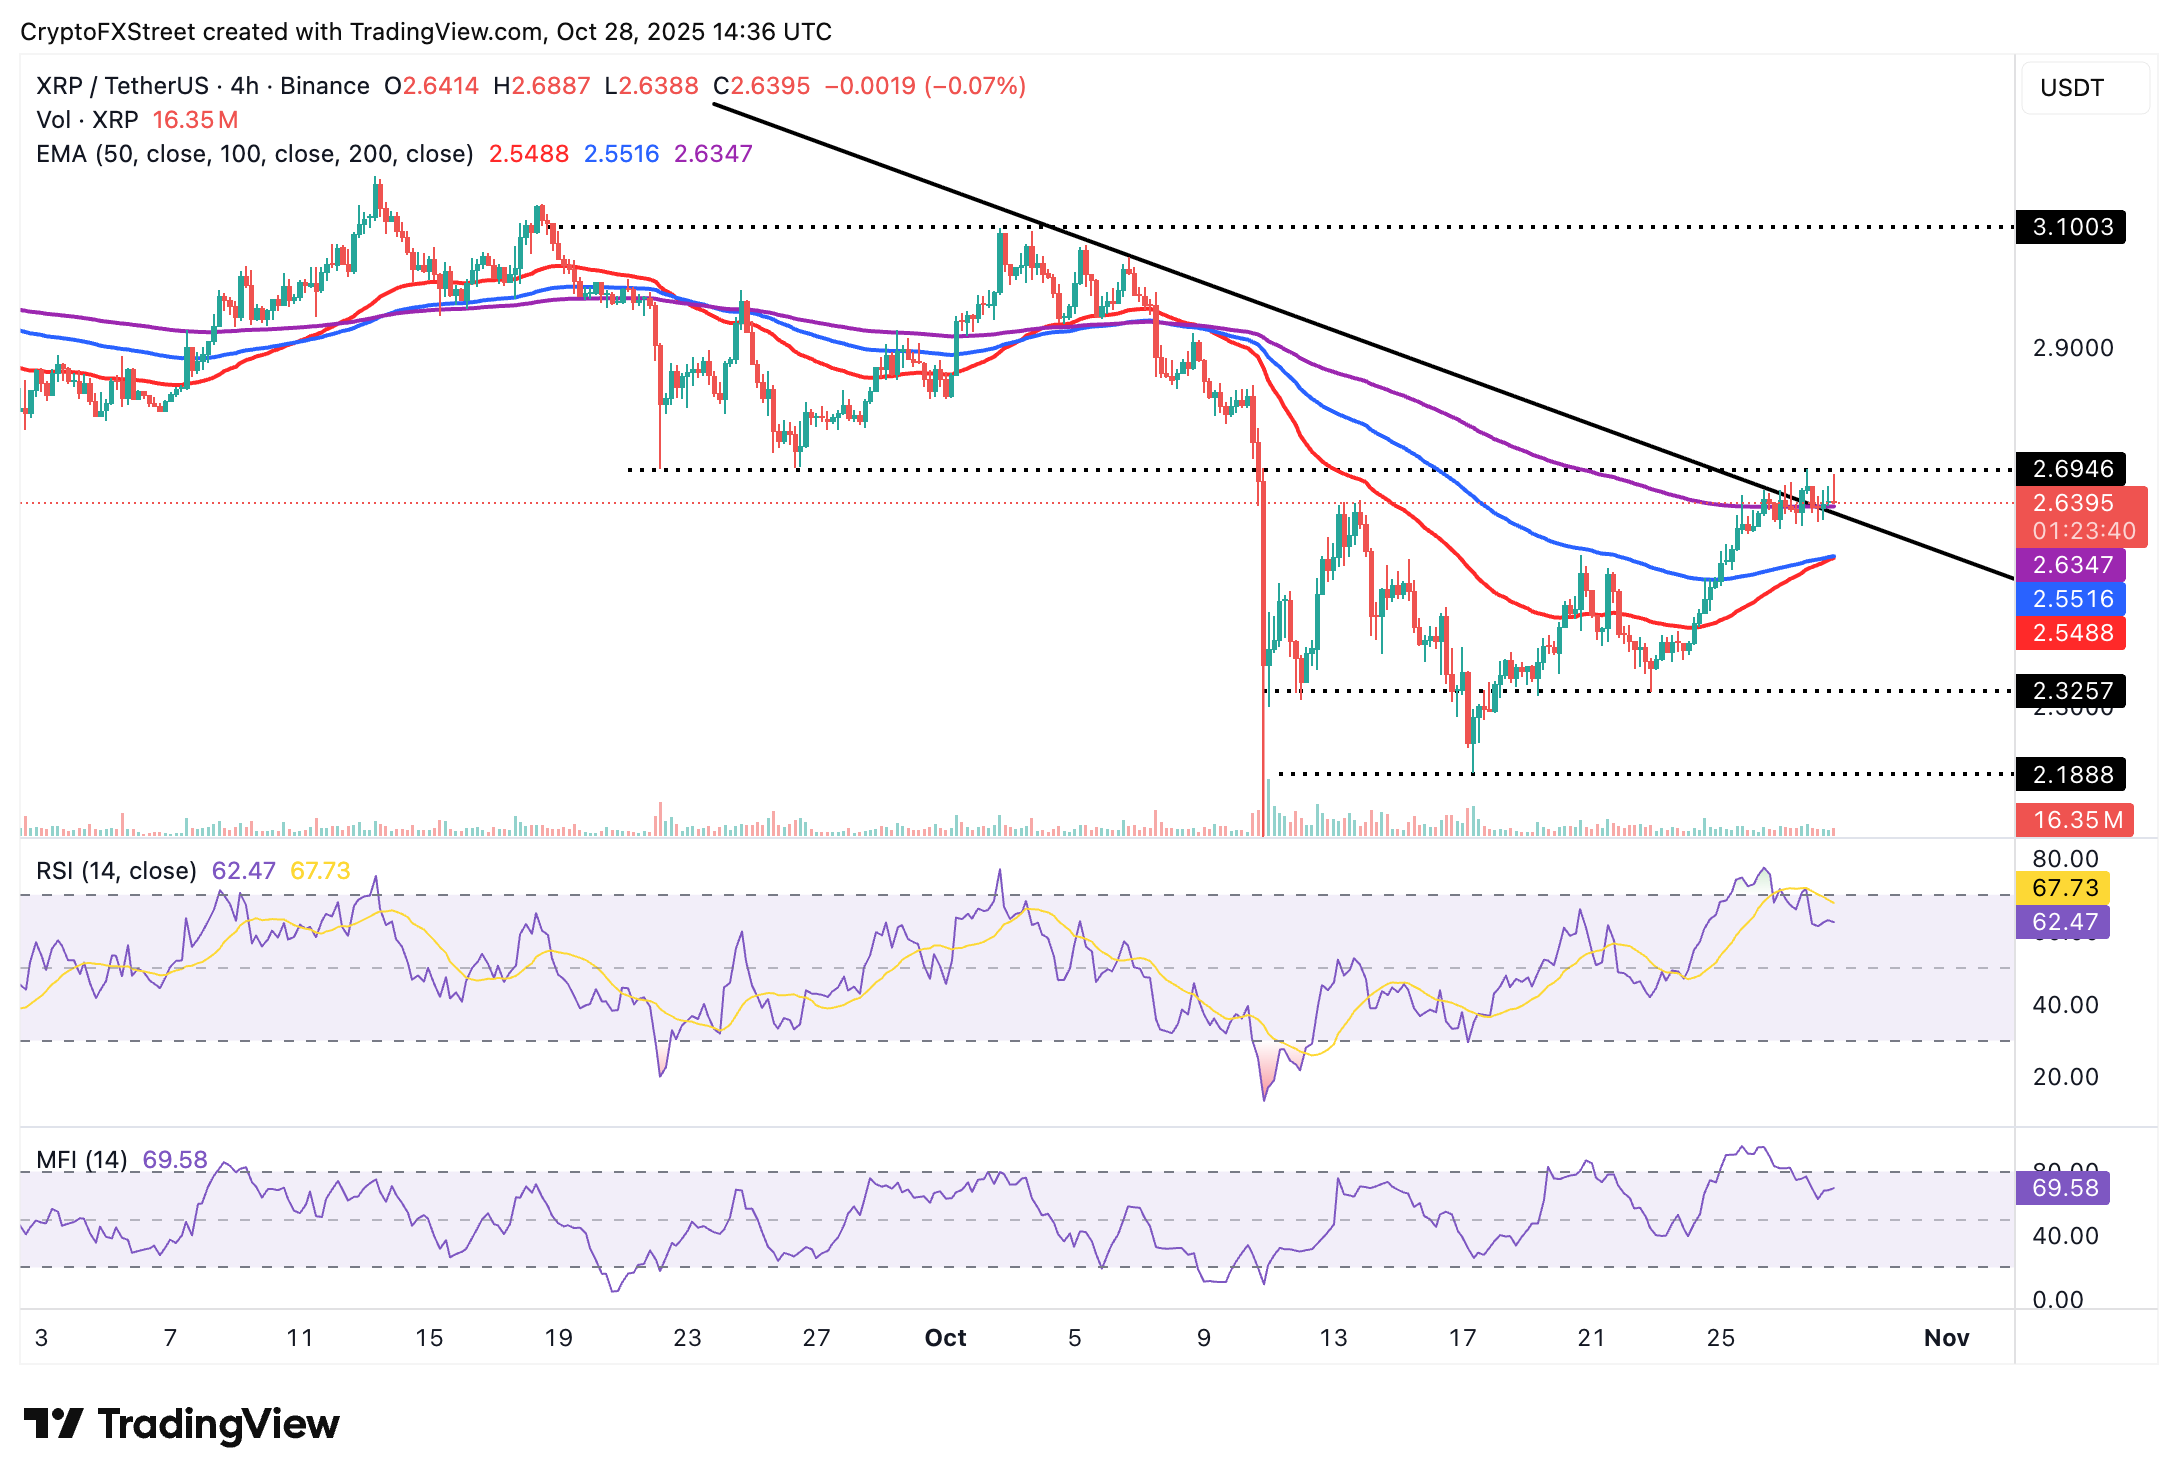
XRP/USDT 4-hour chart
The 50-period EMA and the 100-period EMA converge at around $2.55, forming a confluence support. Other key levels of interest for traders are $2.32, last tested on Wednesday, and $2.18, tested on October 17, if the decline accelerates.
However, XRP could extend its recovery above the immediate $2.70 hurdle if sentiment continues to improve this week, underpinned by the US Federal Reserve (Fed) decision on interest rates. Experts surveyed by the CME Group believe there is a 96.7% chance the Fed will cut rates by 25 basis points, bringing the benchmark to a range of 3.75% to 4.00%.
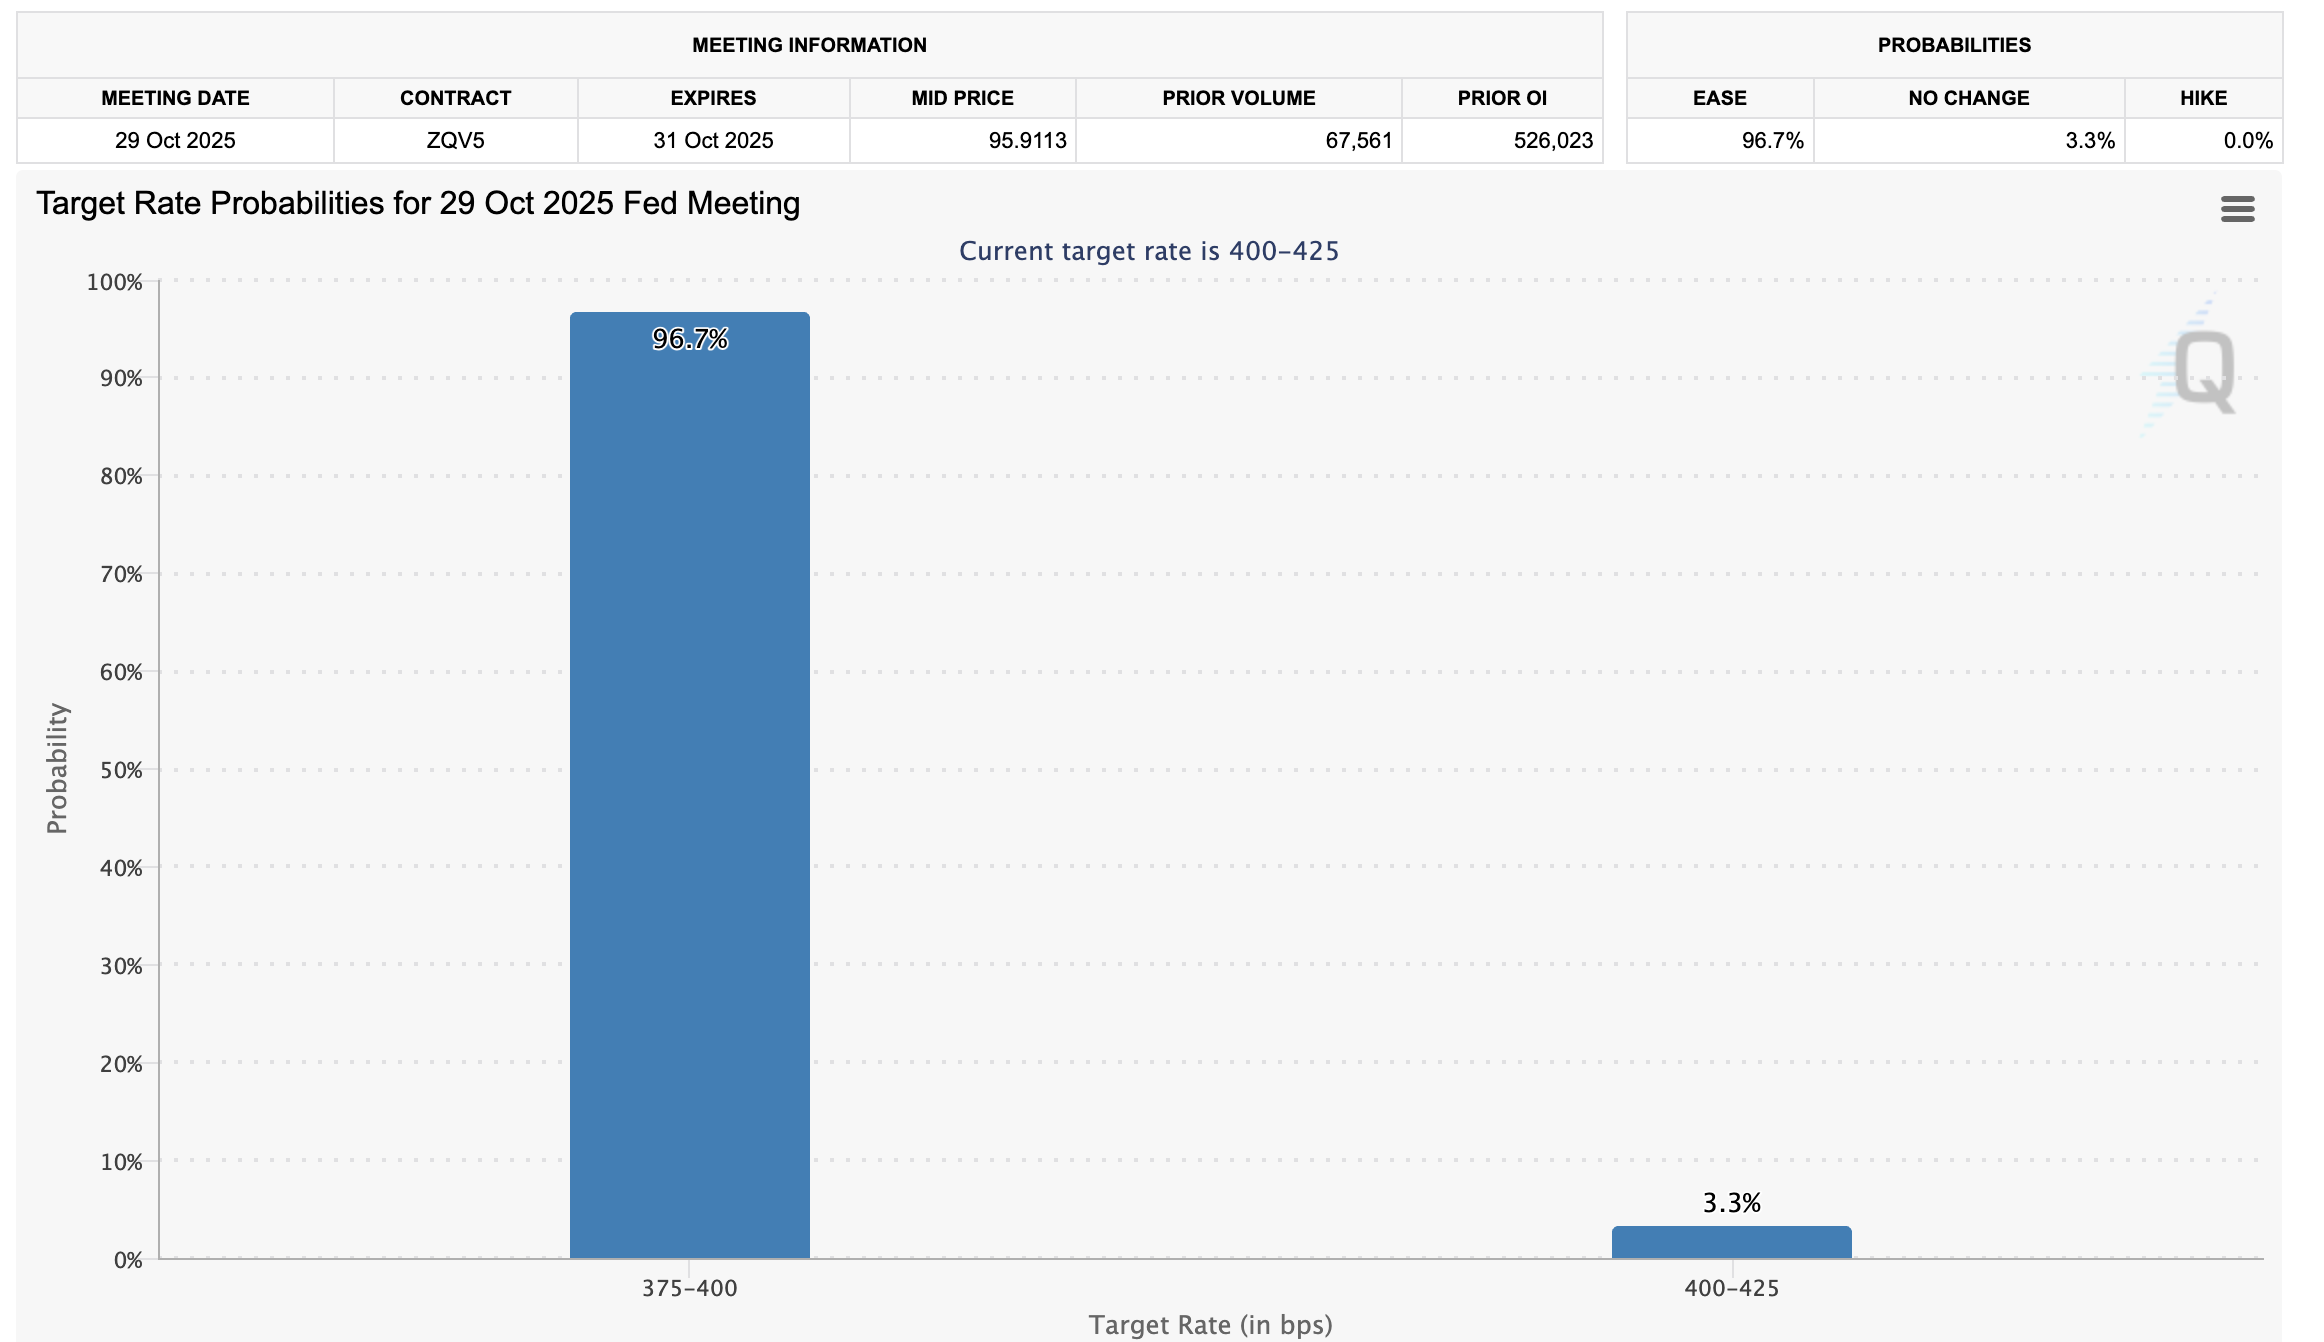
FedWatch tool | Source: CME Group
Interest rate cuts benefit riskier assets such as XRP, particularly if investors diversify their portfolios. The move also gestures that the central bank is loosening its monetary policy, allowing money to flow into the economy.
Cryptocurrency metrics FAQs
The developer or creator of each cryptocurrency decides on the total number of tokens that can be minted or issued. Only a certain number of these assets can be minted by mining, staking or other mechanisms. This is defined by the algorithm of the underlying blockchain technology. On the other hand, circulating supply can also be decreased via actions such as burning tokens, or mistakenly sending assets to addresses of other incompatible blockchains.
Market capitalization is the result of multiplying the circulating supply of a certain asset by the asset’s current market value.
Trading volume refers to the total number of tokens for a specific asset that has been transacted or exchanged between buyers and sellers within set trading hours, for example, 24 hours. It is used to gauge market sentiment, this metric combines all volumes on centralized exchanges and decentralized exchanges. Increasing trading volume often denotes the demand for a certain asset as more people are buying and selling the cryptocurrency.
Funding rates are a concept designed to encourage traders to take positions and ensure perpetual contract prices match spot markets. It defines a mechanism by exchanges to ensure that future prices and index prices periodic payments regularly converge. When the funding rate is positive, the price of the perpetual contract is higher than the mark price. This means traders who are bullish and have opened long positions pay traders who are in short positions. On the other hand, a negative funding rate means perpetual prices are below the mark price, and hence traders with short positions pay traders who have opened long positions.
Author

John Isige
FXStreet
John Isige is a seasoned cryptocurrency journalist and markets analyst committed to delivering high-quality, actionable insights tailored to traders, investors, and crypto enthusiasts. He enjoys deep dives into emerging Web3 tren


