Ripple Price Analysis: XRP/USD struggles to hold above $0.25
- Ripple (XRP/USD) posts modest daily losses on Sunday.
- Key Fibo resistance at $0.2550 limits Ripple's upside.
- Ripple is up more than 3% on a weekly basis.

Ripple (XRP/USD) rose above $0.2550 on Saturday but closed the day virtually unchanged at $0.2518. In Sunday's choppy market action, the pair edged lower and was last seen losing 0.85% on a daily basis at $0.2496.
Ripple technical outlook
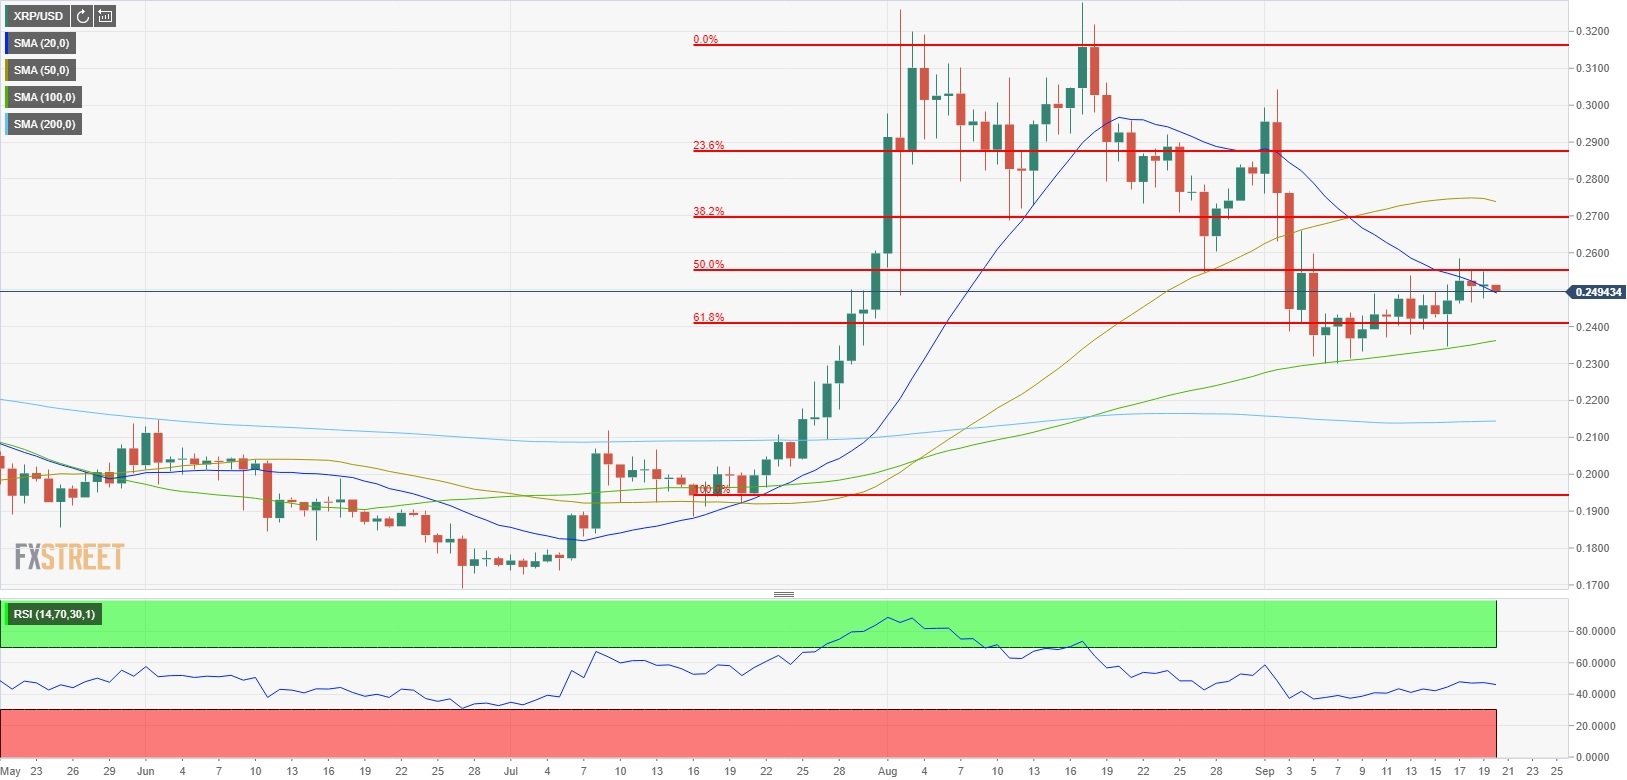
Ripple's failure to close the day above $0.2550 (Fibonacci 50% retracement of July-August rally) opens the door for a further downward correction toward $0.2400 (Fibonacci %61.8 retracement) and $0.2360 (100-day SMA).
On the upside, $0.2700 (Fibonacci 38.2% retracement) is the next target above $0.2550. However, the Relative Strength Index (RSI) indicator on the daily chart stays below 50, suggesting that bullish momentum is struggling to gather strength.
Ripple chart (daily)
Author

Eren Sengezer
FXStreet
As an economist at heart, Eren Sengezer specializes in the assessment of the short-term and long-term impacts of macroeconomic data, central bank policies and political developments on financial assets.


